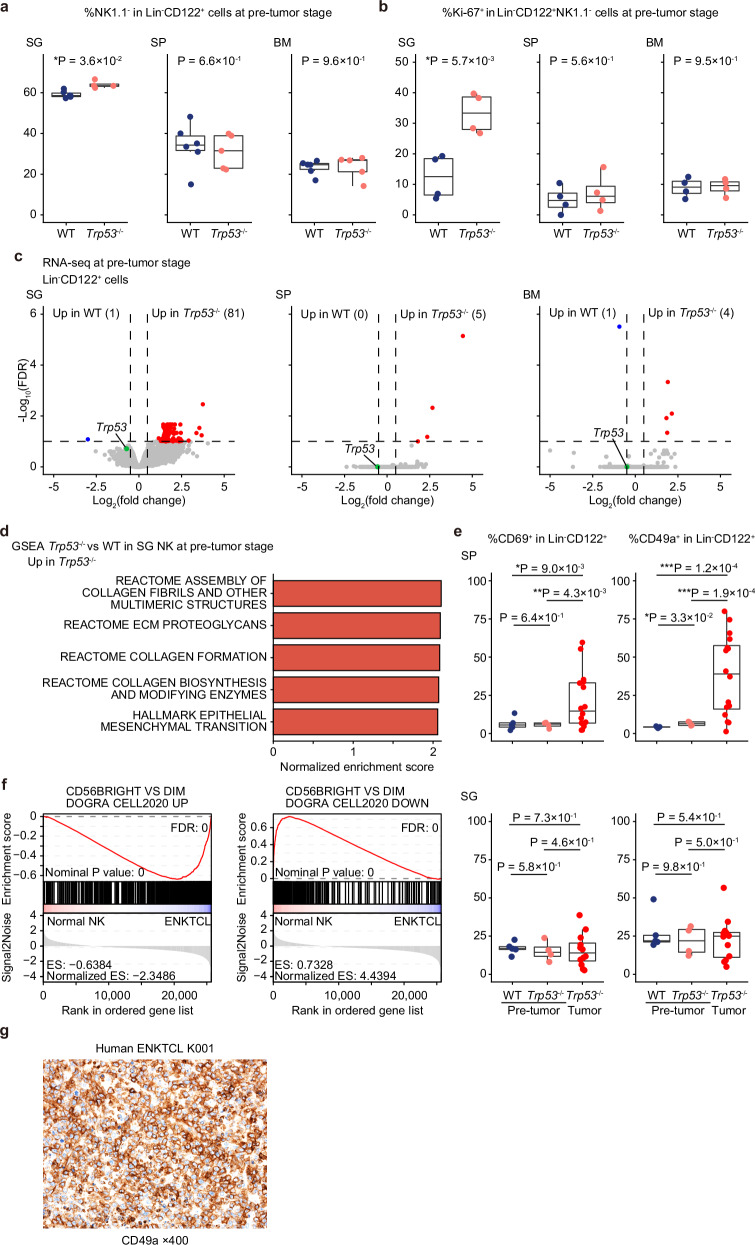
Fig. 2. Differential effects of Trp53 disruption on NK cells across tissues at the pre-tumor stage.
a Proportion of NK1.1− cells in Lin−CD122+ cells in SG, SP, and BM from WT (n = 6) and Trp53−/− (n = 5) mice (at 8 weeks old). b Proportion of Ki-67+ cells in Lin−CD122+NK1.1− cells in SG, SP, and BM from WT (n = 4) and Trp53−/− (n = 4) mice (at 8 weeks old). c Volcano plots showing differentially expressed genes between WT and Trp53−/− Lin−CD122+ NK cells in SG, SP, and BM (at 8 weeks old). Genes with FDR < 0.1 and |log2(fold change)| ≥ 0.5 are considered significant and colored red (upregulated) or blue (downregulated). d The top five upregulated signatures in GSEA analysis of expression data comparing WT (n = 5) and Trp53−/− (n = 3) Lin−CD122+ NK cells in SG (at 8 weeks old). Signatures with FDR < 0.25 are considered significant. e Proportion of CD69+ and CD49a+ cells in Lin−CD122+ NK cells in SG (n = 5 at 8 weeks old) and SP (n = 5 at 8 weeks old) from WT and in SG (n = 6 at 8 weeks old and n = 12 at tumor onset) and SP (n = 6 at 8 weeks old and n = 16 at tumor onset) from Trp53−/− mice. f Significant enrichment of tissue-resident (left) and circulating (right) NK-cell signatures in GSEA analysis of expression data comparing human normal NK cells (n = 4) and ENKTCL tumors (n = 41). g Representative image of CD49a immunostaining in a human ENKTCL sample. a, b, and e, Box plots show medians (lines), IQRs (boxes), and ±1.5× IQR (whiskers). *P < 0.05, **P < 0.005, ***P < 0.0005, two-sided Welch’s t-test. No adjustments were made for multiple comparisons. Source data are provided as a Source Data file.

