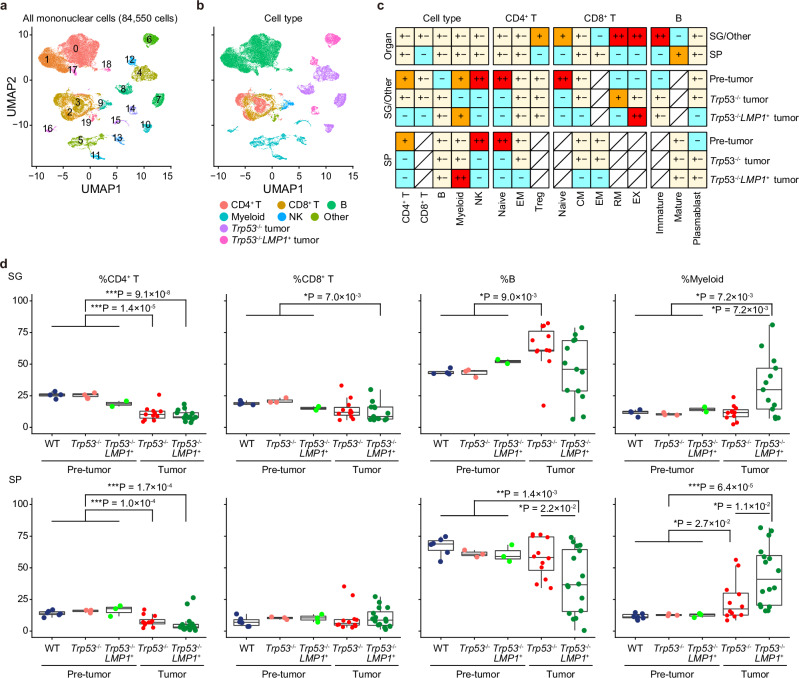
Fig. 4. Single-cell analysis reveals dynamic changes in the tumor microenvironment in NK-cell tumors.
a UMAP plot of 84,550 CD45+ mononuclear cells from SG and SP of WT (n = 1) and Trp53−/− (n = 1) mice at the pre-tumor stage (at 8 weeks old), Trp53−/− tumors in SG (n = 3) and SP (n = 6), and Trp53−/−LMP1+ tumors in other sites (n = 2) and SP (n = 2). Seven malignant and 13 nonmalignant clusters are shown in different colors. b UMAP plot (same as a) colored by cell type. c The distribution of broad and specific cell types in each group in SG and SP revealed by Ro/e analysis (ratio of observed cell number to expected cell number). ++, 2 ≤ Ro/e < 3; +, 1.5 ≤ Ro/e < 2; +/−, 0.67 ≤ Ro/e < 1.5; −, 0 ≤ Ro/e < 0.67. d Proportion of CD4+ T, CD8+ T, B, and myeloid cells from SG (n = 4) and SP (n = 6) of WT, SG (n = 3) and SP (n = 3) of Trp53−/−, and SG (n = 2) and SP (n = 3) of Trp53−/−LMP1+ mice at the pre-tumor stage (at 8 weeks old), Trp53−/− tumors in SG (n = 11) and SP (n = 12), and Trp53−/−LMP1+ tumors in SG (n = 13) and SP (n = 16). Proportion in nonmalignant cells is shown for tumor-bearing mice. Box plots show medians (lines), IQRs (boxes), and ±1.5× IQR (whiskers). *P < 0.05, **P < 0.005, ***P < 0.0005, two-sided Welch’s t-test. Only significant P values (<0.05) are shown. No adjustments were made for multiple comparisons. Source data are provided as a Source Data file.

