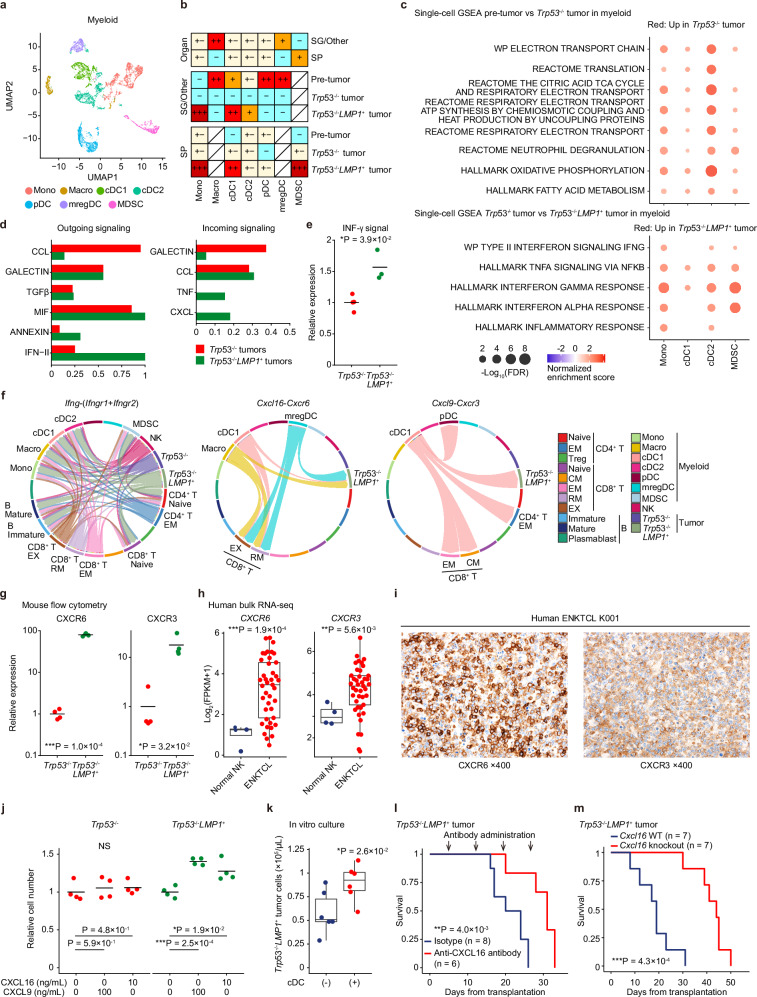
Fig. 5. LMP1 causes prominent myeloid propagation supporting malignant NK-cell proliferation.
a UMAP plot of subclustering of myeloid cells. b The distribution of myeloid subclusters in each group in the extranodal tissues and SP revealed by Ro/e analysis. +++ indicates Ro/e ≥ 3; ++, 2 ≤ Ro/e < 3; +, 1.5 ≤ Ro/e < 2; +/−, 0.67 ≤ Ro/e < 1.5; −, 0 ≤ Ro/e < 0.67. c GSEA analysis of scRNA-seq data comparing each myeloid cell subcluster from pre-tumor samples (SG and SP from WT and Trp53−/− mice) and Trp53−/− tumor samples (top) and from Trp53−/− and Trp53−/−LMP1+ tumor samples (bottom). Signatures significant (FDR < 0.1) across at least two subclusters are shown. d Comparison of outgoing and incoming signals between Trp53−/− and Trp53−/−LMP1+ tumors in CellChat analysis. e Relative IFN-γ expressions in Lin−CD122+ cells from Trp53−/− (n = 4) and Trp53−/−LMP1+ (n = 3) tumors by intracellular flow cytometry. f Chord diagram of Ifng-(Ifngr1+Ifngr2) (left), Cxcl16-Cxcr6 (middle), and Cxcl9-Cxcr3 (right) signaling network across subclusters in Trp53−/− and Trp53−/−LMP1+ tumors. g Relative CXCR6 (left) and CXCR3 (right) expressions in Lin−CD122+ cells from Trp53−/− (n = 4) and Trp53−/−LMP1+ (n = 4) tumors by flow cytometry. h CXCR6 (left) and CXCR3 (right) gene expressions in human normal NK cells (n = 4) and ENKTCL tumors (n = 41) by RNA-seq. i Representative images of CXCR6 (left) and CXCR3 (right) immunostaining in a human ENKTCL sample. j Relative cell number of Trp53−/− and Trp53−/−LMP1+ tumor cells 48 h after CXCL16 or CXCL9 treatment at indicated concentrations (n = 4). k The number of Trp53−/−LMP1+ tumor cells after one week of co-culture with and without cDC (n = 6). l Kaplan–Meier survival curves of mice transplanted with 5 × 10⁵ Trp53−/−LMP1+ tumor cells and administered with anti-CXCL16 antibody (n = 6) or isotype control (n = 8). Log-rank test. m Kaplan–Meier survival curves of WT or Cxcl16 knockout mice transplanted with 5 × 10⁵ Trp53−/−LMP1+ tumor cells and administered with control vehicle or anti-KLRG1 antibody (n = 7 per group). Log-rank test. g, j lines show means. h, k Box plots show medians (lines), IQRs (boxes), and ±1.5× IQR (whiskers). e, g, h, j, and k NS: not significant, *P < 0.05, **P < 0.005, ***P < 0.0005, two-sided Welch’s t-test. No adjustments were made for multiple comparisons. e, g, h, and j–m Source data are provided as a Source Data file.

