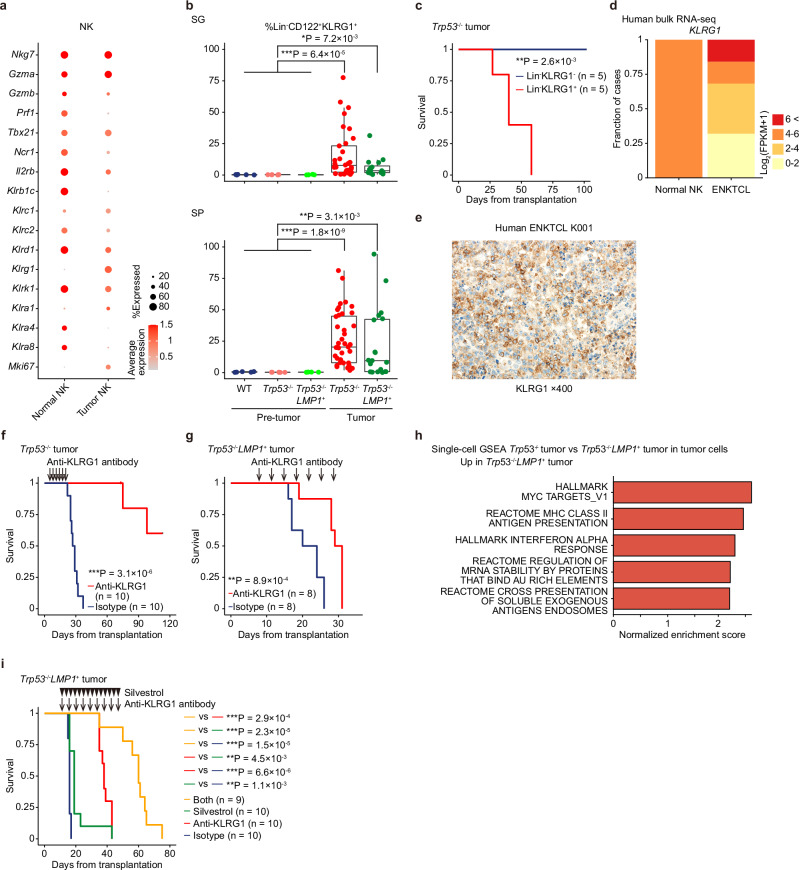
Fig. 6. KLRG1 and MYC as potential therapeutic targets in NK-cell neoplasms.
a Bubble plot comparing NK-cell gene expressions between normal and malignant (Trp53−/− and Trp53−/−LMP1+) NK cells in scRNA-seq data. b Proportion of Lin−CD122+KLRG1+ cells in SG and SP from WT (n = 5 at 8 weeks old), Trp53−/− (n = 6 at 8 weeks old and n = 40 at tumor onset), and Trp53−/−LMP1+ (n = 4 at 8 weeks old and n = 19 at tumor onset) mice. Box plots show medians (lines), IQRs (boxes), and ±1.5× IQR (whiskers). *P < 0.05, **P < 0.005, ***P < 0.0005, two-sided Welch’s t-test. Only significant P values (<0.05) are shown. No adjustments were made for multiple comparisons. c Kaplan–Meier survival curves of mice transplanted with 2 × 10⁴ Lin−KLRG1− (n = 5) and Lin−KLRG1+ (n = 5) cells from Trp53−/− NK-cell tumors. Log-rank test. d Proportion of human normal NK (n = 4) and ENKTCL samples (n = 41) classified by KLRG1 expression in RNA-seq. e Representative image of KLRG1 immunostaining in a human ENKTCL sample. f, g Kaplan–Meier survival curves of mice transplanted with 5×10⁵ Trp53−/− (f) or Trp53−/−LMP1+ tumor cells (g) and administered with anti-KLRG1 antibody or isotype control (n = 10 and n = 8 for Trp53−/− and Trp53−/−LMP1+, respectively). Log-rank test. h, GSEA analysis of scRNA-seq data comparing Trp53−/− and Trp53−/−LMP1+ malignant NK cells. Top five upregulated signatures in Trp53−/−LMP1+ malignant NK cells are shown. Signatures with FDR < 0.25 are considered significant. i Kaplan–Meier survival curves of mice transplanted with 5 × 10⁵ Trp53−/−LMP1+ tumor cells and administered with control vehicle, silvestrol, anti-KLRG1 antibody, or both (n = 10 for control, silvestrol, and anti-KLRG1 antibody; n = 9 for both). Log-rank test. No adjustments were made for multiple comparisons. b, c, f, g, and i Source data are provided as a Source Data file.

