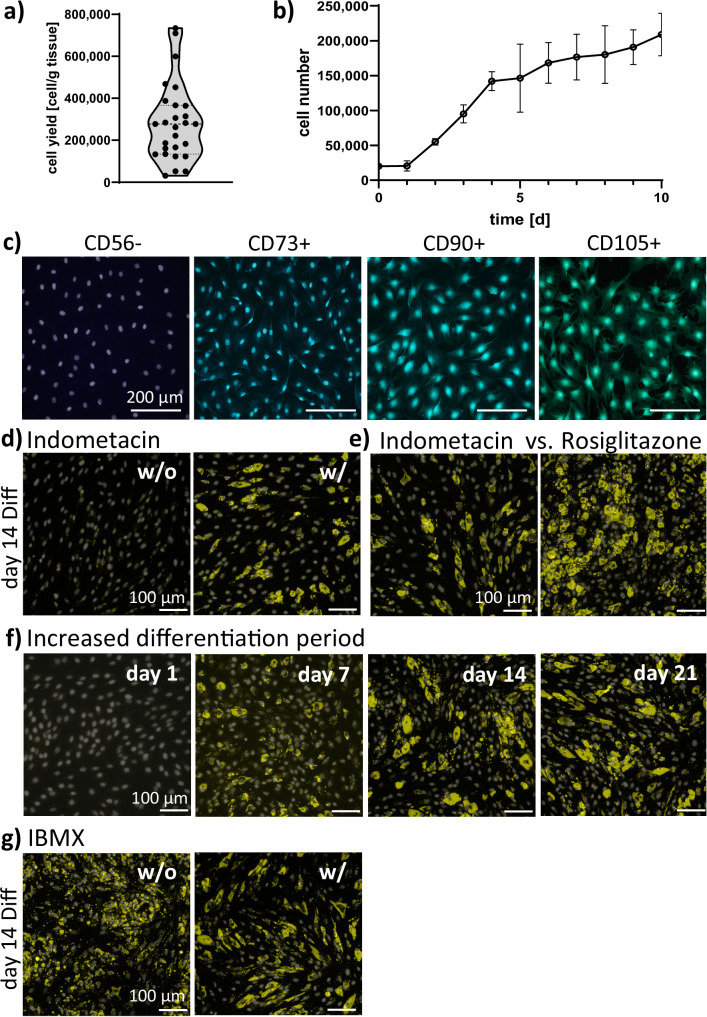
Fig. 2. Characterization of bASC.
a Cell yield of bASC primary isolations n = 27, violin plot cut at lowest and highest value, dotted line: quartile, dashed line: median, dots represent single data points; b Growth kinetics of primary isolated bASCs. Data are plotted as mean and ± standard deviation (SD); c Immunofluorescence staining of different CD markers, scale bar: 200 µm; d Day 14 of 2D bASC differentiation with (w/) and without (w/o) 100 µM indomethacin. DMEM-Diff (DMEM hg, 2.5 µM rosiglitazone, 3 µg/mL bovine insulin and 1 µM dexamethasone) - rosiglitazone + 500 µM 3-Isobutyl-1-methylxanthin (IBMX), scale bar: 100 µm; e Day 14 of 2D bASC differentiation indomethacin vs rosiglitazone. DMEM-Diff + IBMX; scale bar: 100 µm; f 2D bASC differentiation over time until day 21. DMEM-Diff + IBMX, scale bar: 100 µm; g Day 14 of 2D bASC differentiation w/ and w/o IBMX present in DMEM-Diff, scale bar: 100 µm; CD markers: blue/green, lipids stained with BODIPY: yellow, cell nuclei: white.; n = 3 biological replicates. Source data are provided as a Source Data file.

