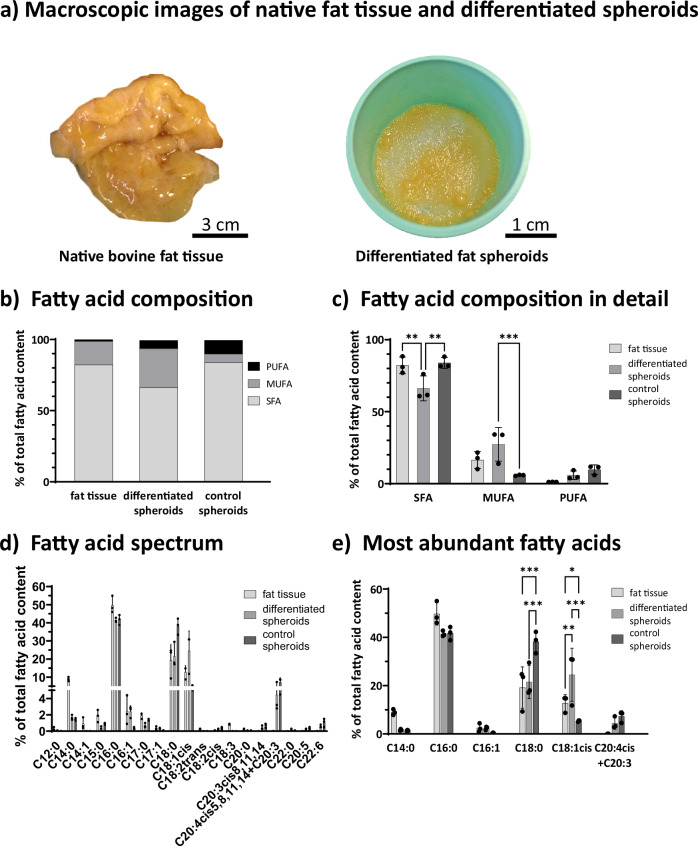
Fig. 6. Fatty acid composition of spheroids and native bovine fat tissue.
a Macroscopic images of native bovine fat tissue (left) and solely dynamically cultured and differentiated fat spheroids after harvest (right). Scale bar: 3 cm and 1 cm; b Overview of saturated (SFA), monounsaturated (MUFA) and polyunsaturated (PUFA) fatty acids in differentiated (Diff) and control (Ctrl) spheroids and bovine fat tissue (Fat).; c Fatty acid composition in detail. Significances are noteable for SFA for Fat vs. Diff (p = 0.0077) and Diff vs. Ctrl (p = 0.0052). MUFA: Diff vs. Ctrl (p = 0.0009); d Fatty acid spectrum of all samples.; e Most abundant fatty acids. Significances are noteable for C18:0 for Fat vs. Ctrl (p < 0.0001) and Diff vs. Ctrl (p < 0.0001). C18:1cis: Fat vs. Diff (p = 0.0017), Fat vs. Ctrl (p = 0.0393), Diff vs. Ctrl (p < 0.0001).; All data are plotted as mean and for (c–e) ± SD. Dots represent single data points.; Significances were calculated using two-way analysis of variance and Holm-Šídák multiple comparisons test; *: p ≤ 0.05, **: p ≤ 0.01, ***p ≤ 0.001; n = 3 biological replicates. Source data are provided as a Source Data file.

