Fig. 7.
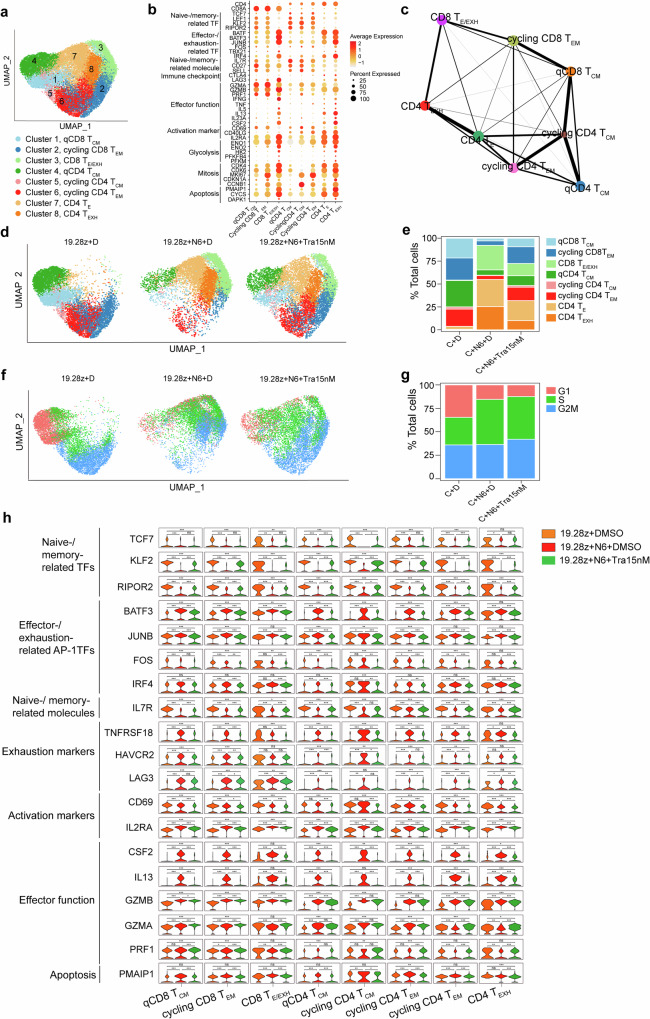
Single-cell transcriptome analysis reveals an increase of memory CAR-T cells while a decrease of effector/exhausted CAR-T cells after MEK inhibition. a The UMAP visualization of 35469 cells from all the samples. 8 clusters are indicated by different colors. b Dot plot illustrating the expression of the marker genes in different clusters. c PAGA analysis shows the potential developmental connectivity among all eight clusters. d, e The UMAP and bar plots show the constitution of the eight clusters in the 3 samples. f, g The UMAP and bar plots show the relative frequency of 19.28z CAR-T cells in each phase of the cell cycle. h The violin plots depict the single-cell expression of the selected genes in each cluster of the three samples. C 19.28z CAR-T, N6 Nalm-6., D DMSO, Tra trametinib. Q, quiescent. Statistical test was a two-tailed Wilcoxon test. *P< 0.05, **P <0.01, ***P < 0.001, ns: not significant

