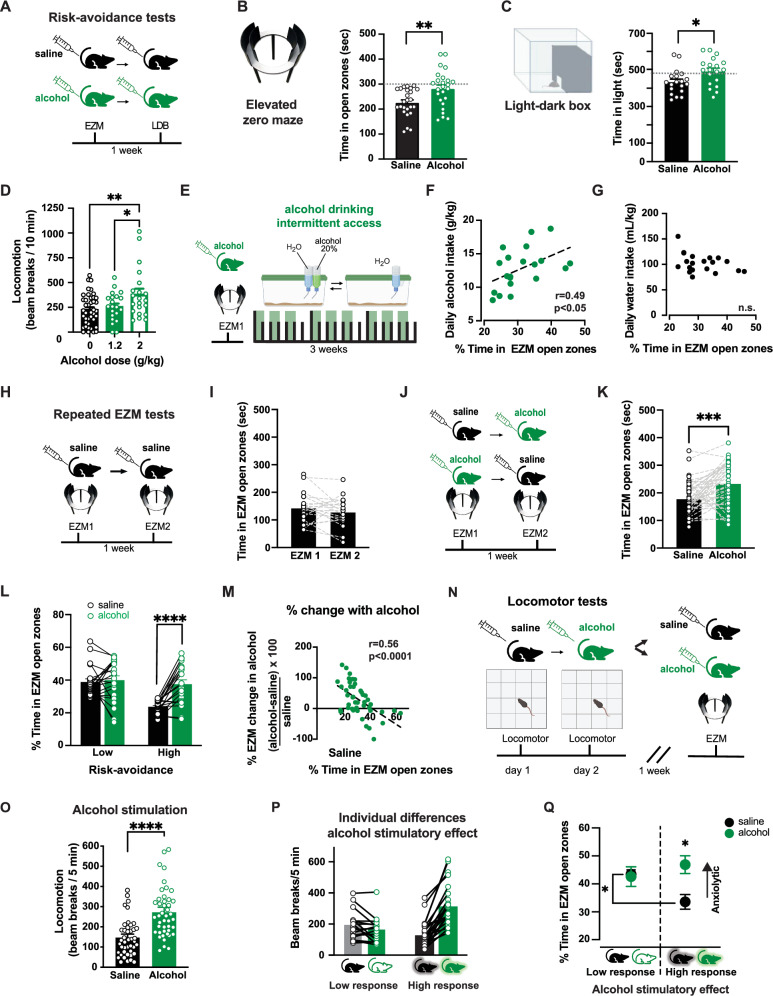
Fig. 1. Individual variation in the expression of anxiety-like behaviors and relief by alcohol in C57BL/6J mice.
A Experimental design for C57BL/6J mice. B, C Time spent in EZM open zones (two-tailed t-test t(48) = 3.0, p = 0.004, n = 25 mice/group) and LDB (t(36) = 2.5, p = 0.017, n = 19 mice/group) for mice receiving saline (black) or 1.2 g/kg alcohol (green). Symbols represent individual mice data; bars and lines represent mean ± SEM of each group. D Locomotor assessment after saline, 1.2, or 2 g/kg alcohol. Only 2 g/kg alcohol significant increased beam breaks compared to saline (p = 0.007) and to 1.2 g/kg alcohol (p > 0.05; 1-Way ANOVA F(2,80) = 5.27, n = 40 saline mice, 21 mice with 1.2 g/kg and 21 mice with 2 g/kg). Symbols represent individual mice data; bars and line represent mean ± SEM of each group. E Mice were tested on EZM after alcohol (1.2 g/kg) followed by 2-bottle intermittent alcohol drinking task. F Positive correlation between EZM performance after alcohol and voluntary alcohol intake (linear regression fit F(1,17) = 5.82, p = 0.027, n = 19 mice). G No correlation was found between EZM performance and water intake (linear regression fit F(1,17) = 2.73, p > 0.05, n = 19 mice). H Mice were tested on EZM twice following saline, one week apart. I EZM performance was similar across saline tests (two-tailed t-test t(20) = 1.31, p = 0.21, n = 21 mice). J, K Separate cohort tested twice on EZM following saline (black) or alcohol (1.2 g/kg; green), using within-subjects counterbalanced design. Time in EZM open zones was higher after alcohol than saline (two-tailed t-test t(42) = 4.23, p = 0.0001, n = 43). L Median split of time spent in EZM open zones after saline (173 s) was used to sort mice into “high” and “low” risk-avoidance groups. Only “high” group shows increased time in EZM open zone following alcohol compared to saline (RM 2-way ANOVA Group x Alcohol interaction: F(1,41) = 11.13, p = 0.002; main effect of Alcohol and Group: Fs(1,41) < 13.22 p = 0.0003, post hoc test p < 0.0008; n = 43). Symbols represent individual mice data; bars and lines represent mean ± SEM of each group. M Inverse correlation between time spent in EZM open zones after saline and percent change in time after alcohol (linear regression fit F(1,41) = 18.74, p < 0.0001, n = 43). Symbols represent individual mice data. N Mice were tested in locomotor boxes after saline and 2 g/kg alcohol and then tested on EZM following saline OR alcohol (1.2 g/kg). O Beam-breaks in locomotor boxes were higher following alcohol than saline (two-tailed t-test t(43) = 5.24, p < 0.0001, n = 44 mice). Symbols represent individual mice data; bars and lines represent mean ± SEM of each group. P Low response mice show no increase after alcohol and high response mice show increase (RM 2-way ANOVA Drug x Group interaction: F(1,42) = 25.58, p < 0.0001; post-hoc test Saline vs Alcohol locomotion p < 0.0001 in “high” group, n = 28 mice and p > 0.05 in “low” group; n = 16 mice). Symbols represent individual mice data; bars and lines represent mean ± SEM of each group. Q Low response mice showed similar EZM performance after saline and 1.2 g/kg alcohol. High response mice showed less time in EZM open zones after saline than low response and time in open is increased after 1.2 g/kg alcohol compared to saline (RM 2-way ANOVA group x EZM interaction: F(1,42) = 4.52, p = 0.039; the difference in saline EZM between low vs high t(20) = 2.10, p = 0.049, n = 22 mice; difference in saline vs alcohol in high response mice t(26) = 3.19, p = 0.004, n = 28 mice). Symbols and line represent mean ± SEM of each group. For all panels, *p < 0.05, **p < 0.01, ****p < 0.0001. Cartoons in panels (B, C, N) are modified BioRender template license Alvarez, V. (2024) BioRender.com/m14d797.

