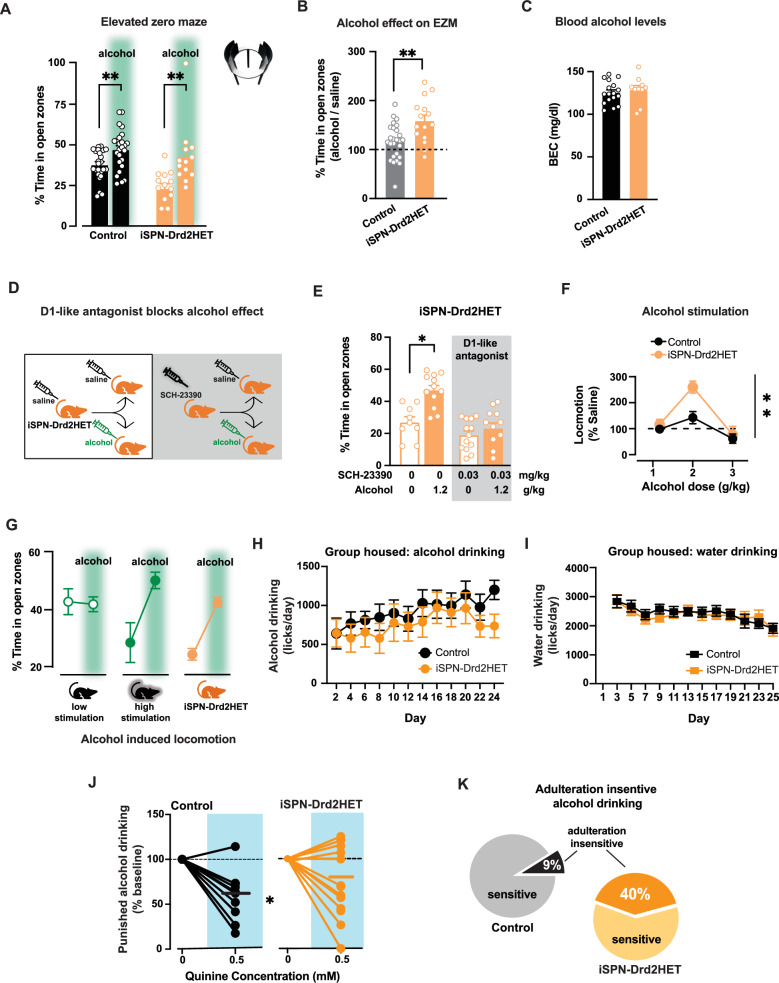
Fig. 5. Stronger alcohol relief and aversive-resistant consumption in mice with high ratio of D1 to D2 receptors.
A Time in the EZM open zones for control (black) and iSPN-Drd2HET (orange) mice after receiving either saline or 1.2 g/kg alcohol (green; i.p.; 2-way ANOVA main effect of alcohol F(1,73) = 2.95, p = 0.09; control mice: saline vs. alcohol t(48) = 3.01, p = 0.004; iSPN-Drd2HET: saline vs. alcohol t(25) = 3.31, p = 0.004, n = 15,26 mice/genotype). EZM cartoon is modified BioRender template license Alvarez, V. (2024) BioRender.com/m14d797. B Normalized time spent on EZM open zones following alcohol relative to time spent following saline for iSPN-Drd2HET (orange) and controls (black) (t-test t(39) = 3.31, p = 0.002, n = 15,26 mice/genotype). C Blood ethanol concentrations (BEC) 10 min after 1.2 g/kg alcohol (i.p.; t-test t(25) = 0.60, p > 0.05, n = 10,17mice/genotype). D iSPN-Drd2HET mice were pretreated with either saline or D1-like antagonist SCH-23390 (0.03 mg/kg; i.p.) then tested on EZM following saline or alcohol (1.2 g/kg; i.p.). E iSPN-Drd2HET mice pretreated with saline showed increased time in EZM open zones after alcohol (2-way ANOVA significant interaction SCH-23390 x Alcohol F(3,41) = 13.5, p < 0.0001; saline versus alcohol: p < 0.05, n = 9,12 mice/group), while mice pretreated with SCH-23390 did not show increased time in EZM open zones after alcohol compared to saline (p > 0.05, n = 11,13 mice/group). F iSPN-Drd2HET mice show stronger locomotor response at 2 g/kg alcohol than littermate controls (RM 2-way ANOVA main effect of Genotype F(2,62) = 5.10, p = 0.009; post hoc test p = 0.011, n = 10,23 mice/genotype). G Summary of EZM performance following saline or 1.2 g/kg alcohol (green shade) for control mice with low and high alcohol stimulation and iSPN-Drd2HET mice (n = 22, 28 control mice and 15 iSPN-Drd2HET mice). H Voluntary alcohol consumption in group-housed, intermittent access, operant paradigm. iSPN-Drd2HET (orange) and littermate controls (black) showed similar consumption of alcohol across sessions (RM 2-way ANOVA no effect of Genotype F(11,241) = 0.52, p > 0.05, n = 11,15 mice/genotype). I Water consumption was similar between genotypes on days alcohol was not available (RM 2-way ANOVA no effect of Genotype F(11,263) = 0.74, p > 0.05, n = 11,15 mice/genotype). J Alcohol intake was measured following quinine adulteration (0.5 mM), and normalized to intake before adulteration for iSPN-Drd2HET (orange) and control (black; RM 2-way ANOVA significant interaction Genotype x Quinine: F(1,23) = 4.95, p = 0.036, n = 11,14 mice/genotype). K Percent mice that drop intake during quinine adulteration (adulteration sensitive) and percent that did not drop (adulteration insensitive); two-tailed binomial test of observed findings (iSPN-Drd2HET) vs expected (control) p < 0.01; n = 11,14 mice/genotype). Data presented as mean ± SEM, *p < 0.05, **p < 0.01.

