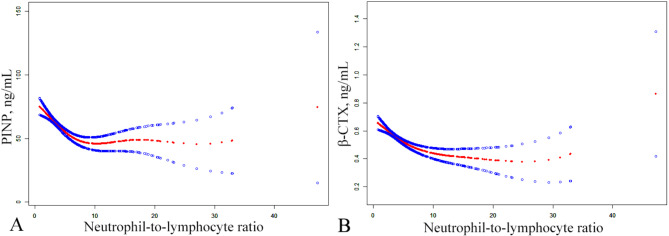
Fig. 2.
The smoothed adjusted curves for NLR, β-CTX and P1NP. The red line denotes the non-linear connection between NLR and both β-CTX and P1NP, whereas the blue line indicates the CI at 95%. Models were adjusted for age, sex, BMI, smoking, drinking, Ca, UA, CR, AST and monocyte; NLR, neutrophil-to-lymphocyte ratio; P1NP, procollagen type 1 N-terminal propeptide; β-CTX, β-C-terminal telopeptide of type I collagen; CI, confidence interval; BMI, body mass index; Ca, calcium; UA, uric acid; CR, creatinine; AST, aspartate aminotransferase.

