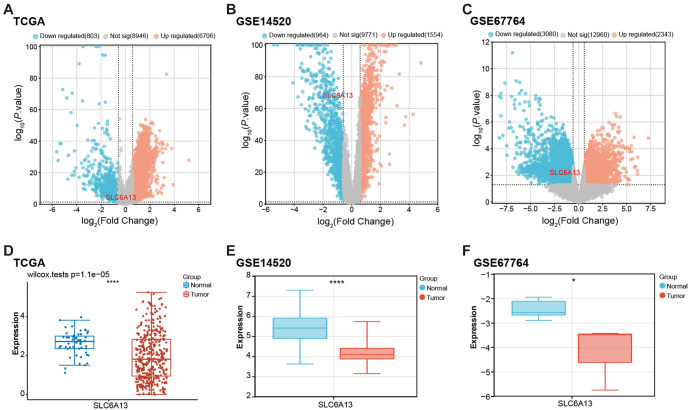
Figure 1.
Identification of DEGs and expression of SLC6A13 in three datasets. (A–C) Volcano plots of DEGs for the TCGA-LIHC dataset, GSE14520 dataset, and GSE67764 dataset. Orange represents upregulated genes, blue represents downregulated genes, and gray represents non-significant genes; (D–F) Box plots of SLC6A13 expression analysis in TCGA-LIHC dataset, GSE14520 dataset, and GSE67764 dataset. Blue represents normal samples and red represents tumor samples. *P < 0.05, ****P < 0.0001. DEG: Differentially expressed genes; TCGA: The Cancer Genome Atlas; SLC6A13: Solute carrier family 6 member 13; TCGA-LIHC: The Cancer Genome Atlas-Liver Hepatocellular Carcinoma.

