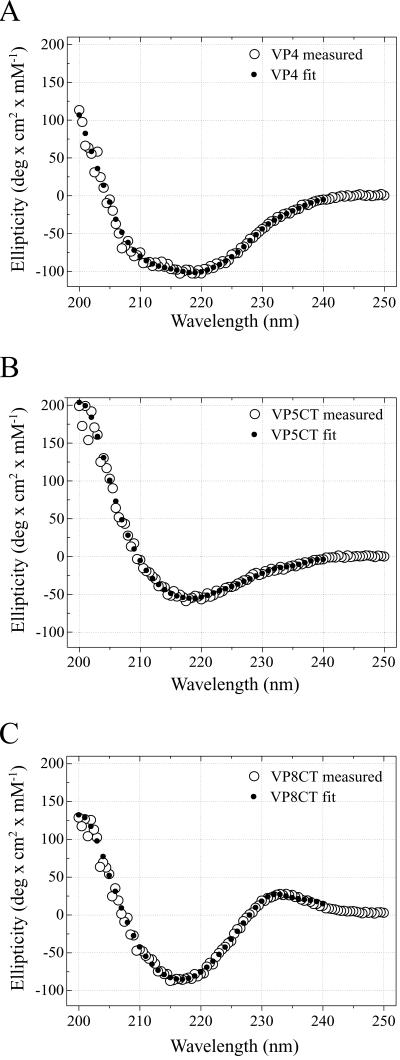
FIG. 7.
CD spectroscopy. In each plot, the experimentally measured mean residue molar ellipticity is depicted by open circles (measured); the ellipticity of a model protein with the composition indi- cated in Table 1 is depicted by filled circles (fit). The fit composition was determined using CONTIN (30). (A) VP4; (B) VP5CT; (C) VP8CT. deg, degree.

