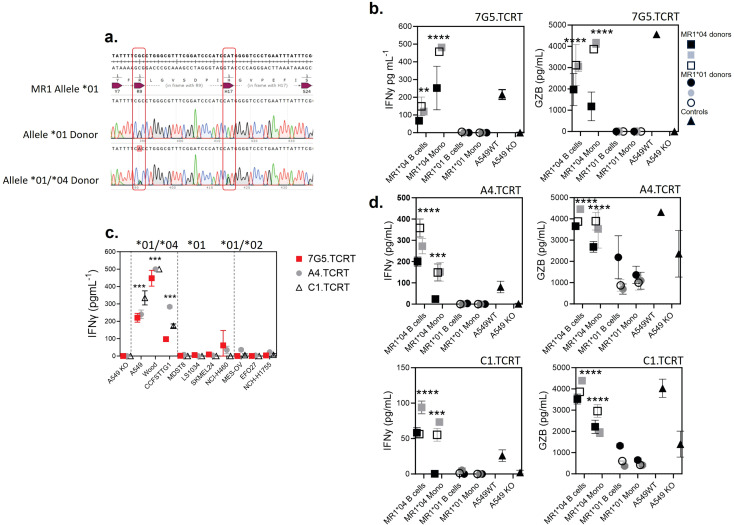
Figure 6.
T cells transduced with 7G5 and 7G5-like TCRs are activated by MR1*04 expressing healthy cells. (A) Sanger sequencing of the MR1 locus of two of 200 blood donors analyzed. The MR1*01 allele and MR1*04 allele differ by two nucleotide substitutions leading to R9H/H17R substitutions in the MR1*04 allele. The lower row shows a donor heterozygous for MR1*01/*04, note the miscalling of the mixed nucleotides at both positions. (B) Reactivity of one representative donor of three 7G5.TCR-T donors to monocytes and B cells derived from PBMC from three MR1*01/*04 heterozygous blood donors, and three MR1*01 homozygous donors. IFN-γ (left) and granzyme B (right) were measured by ELISA at 48 h following the co-culture of 40,000 PBMC-derived cells and 200,000 7G5.TCR-T (E:T ratio: 5:1). Grey, black, and white squares represent monocytes and B cells from three MR1*01/*04 donors. Grey, black, and white circles represent monocytes and B cells from three MR1*01 donors. Black triangles represent the positive and negative controls A549 and A549.MR1KO, respectively, one donor with nine technical replicates. ** p < 0.01 and **** p < 0.0001—significant differences between reactivity to MR1*04 targets vs. MR1*01. (C) Reactivity of the 7G5.TCR-T (red) and TCR-T expressing the 7G5-like TCRs A4 and C1 to cancer cell lines homozygous for MR1*01 or heterozygous for MR1*01 and MR1*02 or MR1*04. Reactivity was measured with IFN-γ ELISA at 48 h following the co-culture of 20,000 cancer cells and 60,000 7G5.TCR-T (E:T ratio: 3:1), and data shown are representative of two biological repeats with two separate donors for TCR-T. *** p < 0.001 by one-way ANOVA with Tukey’s multiple comparison test indicating significant differences between 7G5 and 7G5-like TCR reactivity to MR1*04 expressing targets compared to MR1*04-negative cells. (D) A4-TCR-T and C1-TCR-T reactivity of one representative of three TCR-T donors to monocytes and B cells derived from PBMC from three MR1*01/*04 heterozygous blood donors and three MR1*01 homozygous donors. IFN-γ and granzyme B were measured by ELISA at 48 h following the co-culture of 40,000 PBMC-derived cells and 200,000 7G5-TCR-T (E:T ratio: 5:1). Grey, black, and white squares represent monocytes and B cells from three MR1*01/*04 donors. Grey, black, and white circles represent monocytes and B cells from three MR1*01 donors. Black triangles represent the positive and negative controls A549 and A549.MR1KO, respectively, from one donor with nine technical replicates. *** p < 0.001 and **** p < 0.0001—significant difference between reactivity to MR1*04 targets vs. MR1*01.

