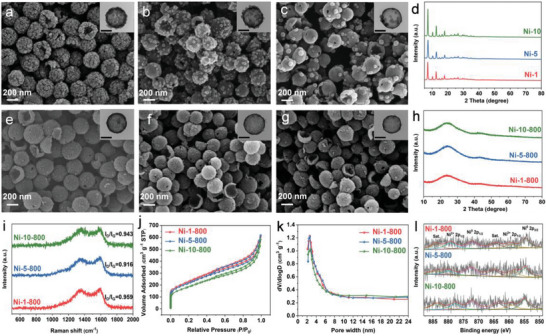
Figure 3.

SEM images of a) Ni‐1, b) Ni‐5, and c) Ni‐10, (inset) TEM images of the corresponding samples (scale bar 100 nm). d) XRD patterns of Ni‐1, Ni‐5, and Ni‐10 samples. SEM images of e) Ni‐1‐800, f) Ni‐5‐800, and g) Ni‐10‐800, (Inset) TEM images of the corresponding samples (scale bar 100 nm). h) XRD patterns, i) Raman spectrums, j) N2 adsorption–desorption isotherms, k) BJH pore size distribution, and l) High‐resolution Ni 2p spectrums of Ni‐1‐800, Ni‐5‐800, and Ni‐10‐800 samples.
