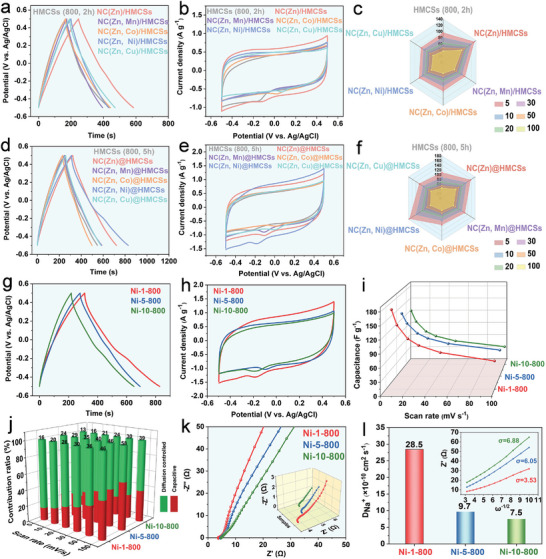
Figure 4.

a) GCD diagrams at 0.5 A g−1, b) CV diagrams at 5 mV s−1, and c) the corresponding specific capacitances versus scan rates of HMCSs (800, 2 h), NC (Zn)/HMCSs, NC(Zn, Mn)/HMCSs, NC(Zn, Co)/HMCSs, NC(Zn, Ni)/HMCSs, and NC(Zn, Cu)/HMCSs in 1.0 m NaCl solution. d) GCD diagrams at 0.5 A g−1, e) CV diagrams at 5 mV s−1, and f) the corresponding specific capacitances versus scan rates of HMCSs (800, 5 h), NC(Zn)@HMCSs, NC(Zn, Mn)@HMCSs, NC(Zn, Co)@HMCSs, NC(Zn, Ni)@HMCSs, and NC(Zn, Cu)@HMCSs in 1.0 m NaCl solution. g) GCD diagrams at 0.5 A g−1, h) CV diagrams at 5 mV s−1, and i) The corresponding specific capacitances versus scan rates of Ni‐1‐800, Ni‐5‐800, Ni‐10‐800 in 1.0 m NaCl solution. j) Capacitive ratio of Ni‐1‐800, Ni‐5‐800, and Ni‐10‐800 electrode materials at various scan rates. k) EIS of the Ni‐1‐800, Ni‐5‐800, and Ni‐10‐800 electrodes. l) Na+ diffusion coefficients and the corresponding charts of Z’(Ω) versus w−1⁄2.
