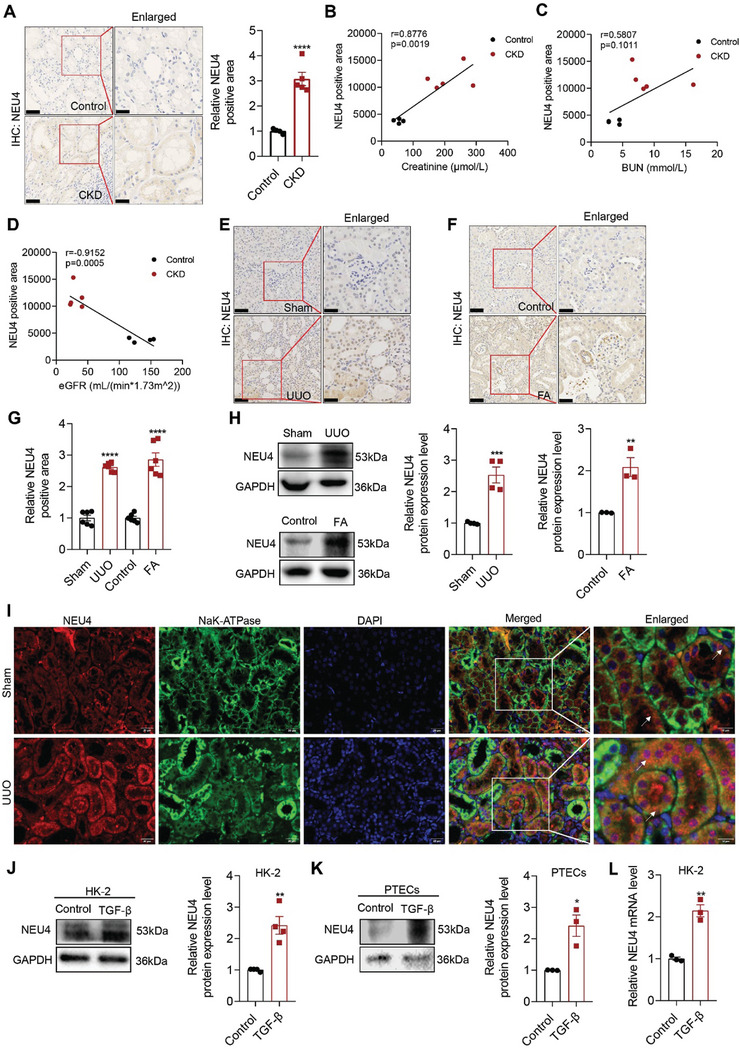
Figure 1.

NEU4 was significantly increased in human and mouse fibrotic kidneys. A) Representative immunohistochemical micrographs and quantification of NEU4 expression in kidney from patients with CKD. Scale bar, 50 µm. patients, n = 4–5 samples. B–D) Pearson's correlation of NEU4 with serum creatinine level (B), blood urea nitrogen (BUN) (C), and estimated glomerular filtration rate (eGFR) (D) (n = 9, Pearson χ2 test). E,F) Representative immunohistochemical micrographs of NEU4 in kidney from mice subjected to UUO (E) and mice subjected to folic acid (F). Scale bar, 50 µm. n = 6 mice. G) Quantification of NEU4 expression in Figure 1E,F. H) Western blot (left panel) and quantification (right panel) of the protein expression of NEU4 in left kidneys from mice subjected to UUO or folic acid. GAPDH served as loading control, n = 3–4 mice. I) Immunofluorescence images of NEU4 and Na+/K+‐ATPase in kidney from mice subjected to UUO. Na+/K+‐ATPase was used as tubular epithelial cell marker. Scale bar, 50 µm. n = 3 mice. J) Western blot (left panel) and quantification (right panel) of the protein expression of NEU4 in HK‐2 cells treatment with TGF‐β 24 h. GAPDH served as loading control, n = 4 samples. K) Western blot (top panel) and quantification (bottom panel) of the protein expression of NEU4 in PTECs treatment with TGF‐β 24 h. GAPDH served as loading control, n = 3 samples. L) NEU4 mRNA level in HK‐2 cells treatment with TGF‐β 24 h. n = 3 samples. Error bars represent mean ± SEM. Comparisons between two groups were analyzed by using a two‐tailed Studentʹs t test. *p < 0.05, **p < 0.01, ***p < 0.001, ****p < 0.0001 versus the Sham or Control group.
