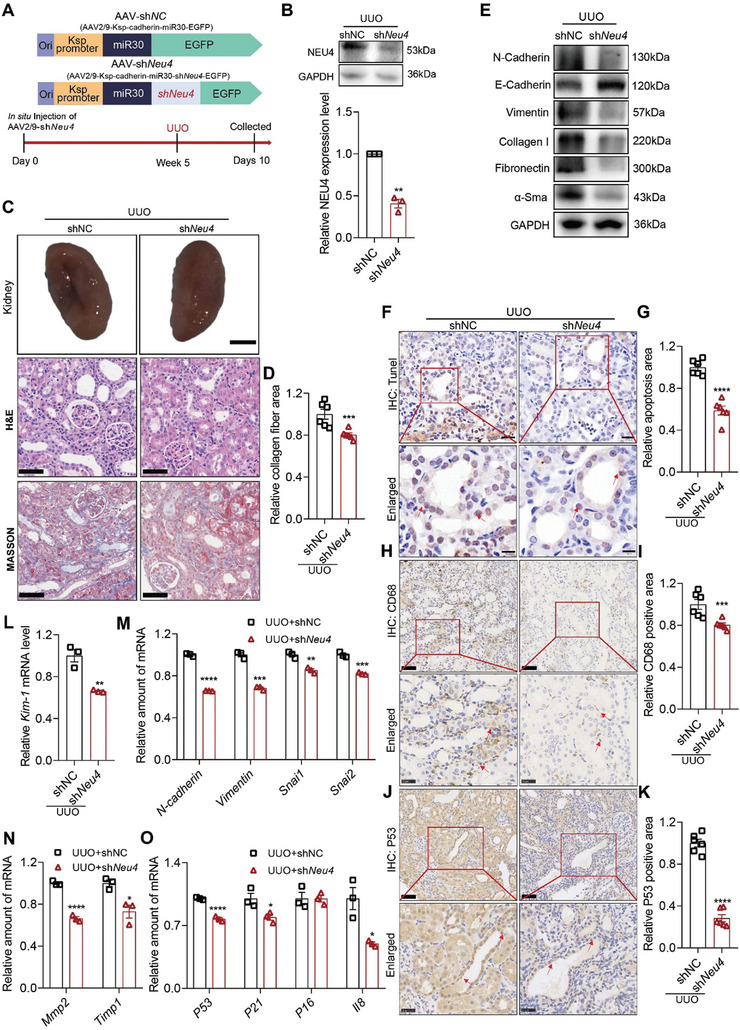
Figure 3.

Neu4 knockdown alleviated UUO‐induced renal fibrosis in mice. A) Scheme of the experimental approach. Mice were in situ injected with adeno‐associated virus (AAV2/9) carrying a coding sequence of mouse shNeu4 under kidney‐specific cadherin promoter (AAV2/9‐cadherin‐miR30‐shNeu4‐EGFP, referred as shNeu4) or shNC (AAV2/9‐cadherin‐miR30‐EGFP). Five weeks after injection, the mice were subjected to UUO surgery for 10 days. UUO, unilateral ureteral obstruction. B) Western blot (top panel) and quantification (bottom panel) of the protein expression of NEU4 in left kidney. GAPDH served as loading control, n = 3 mice. C,D) The gross appearance of kidneys (n = 3 mice. Scale bar, 2 mm), H&E staining and Masson's trichrome staining from left kidneys, and renal interstitial fibrosis scores based on Masson's trichrome staining (D). n = 6 mice. Scale bar, 50 µm. E) Western blot of the expression of N‐Cadherin, E‐Cadherin, Vimentin, Collagen I, Fibronectin and α‐Sma. GAPDH served as loading control. n = 3–5 mice. F,G) Measurement (F) and quantification (G) of apoptosis by TUNEL staining in left kidney. n = 6 mice. Scale bar, 20 µm. H–K) Immunohistochemistry staining analysis and quantification of CD68 (H and I) and P53 (J and K) in kidney tissues. n = 6 mice. Scale bar, 50 µm. L) Kim‐1 mRNA level. n = 3 mice. M–O) Relative mRNA level of EMT‐associated genes (M), extracellular matrix‐associated genes (N) and senescence‐associated genes (O) were determined by RT‐qPCR, n = 3 mice. Error bars represent mean ± SEM. Comparisons between two groups were analyzed by using a two‐tailed Studentʹs t test. *p < 0.05, **p < 0.01, ***p < 0.001, ****p < 0.0001 versus the shNC.
