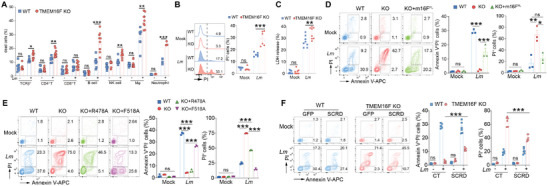
Figure 1.

Lipid scrambling mediated by TMEM16F essentially counteracts cell death induced by Lm. A) Quantification of TCRβ+ T (TCRβ+NK1.1−) cell, CD4+ T (CD4+ CD8−) cell, CD8+ T (CD4− CD8+) cell, B (B220+ TCRβ−) cell, NK (TCRβ−NK1.1+) cell, macrophage (F4/80+CD11b+) cell and neutrophil (Ly6G+CD11b+) cell permeabilization (DAPI+) in splenocytes infected by Lm for 1 h. The MOI of infected neutrophils was 50 and that of other immune cells was 5. (n = 3‐9). B) Plasma membrane damage in BMDM infected with Lm for 8h detected with PI staining (MOI = 15, n = 6). C) LDH release assay as in (B) (n = 8). D) Representative flow cytometry plots (left panel) of cells in WT, TMEM16F KO and KO rescued with full length TMEM16F (KO+m16FFL) RMA cells ± Lm for 2h and stained with Annexin V and PI. Quantification of PS exposure (Annexin V+PI−) and cell death (PI+) on the right panel (MOI = 15, n = 3). E) As in D, flow cytometry plots (left) for WT and TMEM16F KO RMA cells ectopically expressing GFP (CT, control), R478A, or F518A TMEM16F mutants, after Lm infection for 2h, and the statistical analysis of PS exposure (Annexin V+PI−) and cell death (PI+) (right) (MOI = 15, n = 3). F) As in E, Annexin V and PI staining for the WT and TMEM16F KO RMA cells overexpressing GFP (CT) or scramblase domain chimeras (SCRD) ± Lm infection for 2 h (left). Quantification of PS exposure and cell death was on the right panel (MOI = 15, n = 6). All the experiments were performed for at least two times independently. Data are presented as mean ± SEM. The “n” represents the technical replicates. Statistical analysis was two‐way ANOVA for A to F. ns, not significant. * p < 0.05, ** p < 0.01, *** p < 0.001.
