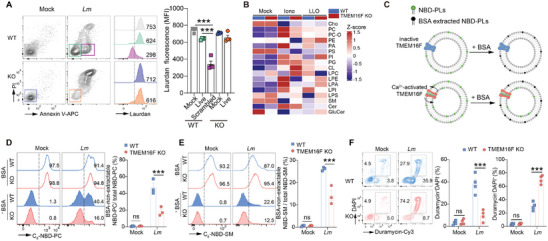
Figure 3.

Extensive plasma membrane lipids reshuffling by TMEM16F in response to Listeria infection. A) Representative flow cytometry plots of Annexin V and PI (left) in WT and TMEM16F KO RMA cells after Lm infection and the histogram of Laurdan dye fluorescence (middle panel, numbers depict the MFI) from the indicated gates. Quantification of Laurdan dye fluorescence is on the right panel (n = 4) (Mock, uninfected; Live, Annexin V−PI−; Scrambled, Annexin V+PI−). B) The heatmap of lipidomic analysis of plasma membrane purified from WT and TMEM16F KO thymocytes treated with or without ionomycin or LLO (n = 3‐4). C) Schematic diagram of TMEM16F‐mediated membrane lipid scrambling detected by NBD‐labeled lipid probe after Lm infection. D,E) As illustrated in (C), representative histogram (left) and percentage of scrambling (right) for NBD‐PC (D) or NBD‐SM (E) in WT and TMEM16F KO RMA cells after Lm infection. Percent of NBD+ population was indicated on the histogram. n = 3. F) As in (A), representative flow cytometry plots of duramycin and DAPI staining (left) for WT and TMEM16F KO RMA cells after Lm infection, with the statistical analysis on the right (n = 4). All the experiments were repeated for at least two times independently and data are presented as mean ± SEM. The “n” represents the technical replicates. Unpaired Student's t test for A and two‐way ANOVA for D to F. ns, not significant. *** p < 0.001.
