Figure 4.

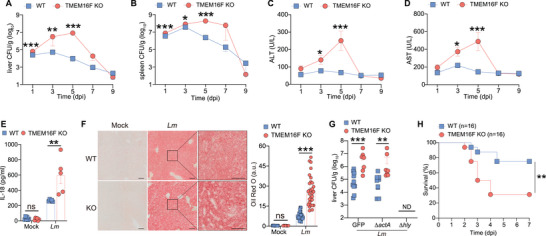
Pro‐inflammatory response and tissue damage elicited by L. monocytogenes infection in the loss of TMEM16F. A,B) Bacterial load (CFU) in the liver and spleen from WT and TMEM16F KO mice at indicated time post infection. Pooled data from three independent experiments, n = 8‐16. C,D) Serum ALT and AST from mice as in (A and B). Pooled data from two independent experiments, n = 6‐10. E) Level of IL‐18 in serum obtained from uninfected (Mock) and Lm‐infected WT and TMEM16F KO mice at 3 dpi (n = 5‐6). F) Oil Red O staining of liver sections from uninfected (Mock) and Lm‐infected WT and TMEM16F KO mice at 3 dpi (left) and quantification in (F) (a.u., arbitrary unit) (right). Mock, n = 10; Lm, n = 30. Scale bar, left 100 µm, right 50 µm. G) Bacterial burden in the liver after Lm infection at 3 dpi. ND, not detected. ΔactA, actA KO; Δhly, LLO KO; GFP, control Lm. n = 7‐11. H) Survival curve of WT and TMEM16F KO mice after infection by actA KO Lm. Data were pooled from three independent experiments (n = 16). All the experiments were performed for at least two independent times. Data are presented as mean ± SEM. Statistical analysis by two‐way ANOVA with Dunnett's multiple comparisons test (E,F), logrank (Mantel–Cox) test (H) or two‐tailed Mann–Whitney test (A–D and G). ns, not significant. * p<0.05, ** p<0.01, *** p<0.001.
