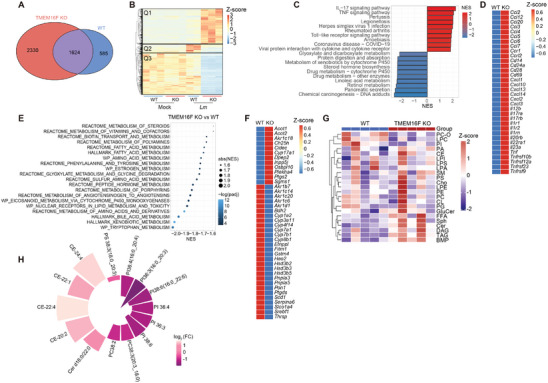
Figure 5.

Loss of TMEM16F results in excessive pro‐inflammatory response and dysregulated lipid metabolism in the liver in response to Lm infection. All samples used in ‐omics analysis were acquired at 3 dpi. A) Venn diagram showed differentially expressed genes (DEGs) in WT and TMEM16F KO mice after Lm infection. B) Heatmap of gene transcriptional profiles obtained from the liver of uninfected (Mock) and Lm‐infected WT and TMEM16F KO mice. C) Top enriched KEGG pathways of DEGs in (A). D) Heatmap of pro‐inflammatory genes in Lm‐infected WT and TMEM16F KO mice. E) The metabolic pathway enrichment analysis between WT and TMEM16F KO mice based on the Gene Signature Enrichment Analysis (GSEA) database. F) Heatmap of genes involved in lipid metabolism from the liver of Lm‐infected WT and TMEM16F KO mice. G) Liver lipidomic analysis in Lm‐infected WT and TMEM16F KO mice (n = 5). Heatmap analysis of lipids between WT and TMEM16F KO samples. H) Individual lipids with padj<0.05 between WT and KO groups (n = 5).
