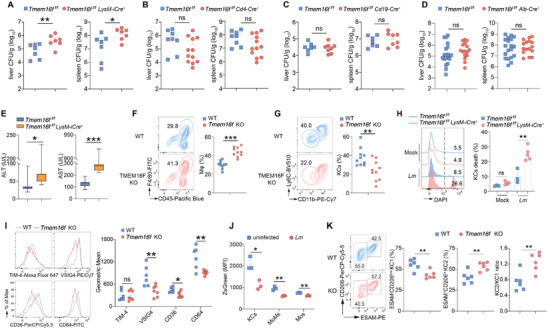
Figure 6.

Depletion of Kupffer cells upon Lm infection due to the ablation of TMEM16F. (A to D) Quantification of bacterial load in the liver and spleen from various tissue‐specific Tmem16f KO mice and their corresponding littermate controls at 3 dpi. Data were pooled from at least two independent experiments. n = 7 for (A), n = 8‐12 for (B), n = 7–8 for (C), n = 16‐20 for (D). E) Quantification of serum ALT and AST activity from myeloid‐specific Tmem16f KO mice at 3 dpi. Data were pooled from at least two independent experiments. n = 7. F) Flow cytometry analysis of macrophages (CD45+F4/80+) in the liver from Lm‐infected WT and TMEM16F KO mice at 3 dpi. Data were pooled from two independent experiments (n = 10). Mϕ, macrophages. G) Flow cytometry analysis of cells gated on (F). KCs are gated on CD11bloLy6Clo. n = 10. H) Representative histogram (left) and percentage of KCs death (right) after Listeria infection for 1 h in vitro. Cells were isolated from LysM‐iCre‐Tmem16ffl/fl and Tmem16ffl/fl control mice. MOI = 10, n = 3–5. I) Expression of typical KCs (CD45+F4/80+CD11b+CLEC2+) surface markers (n = 6–7) in WT and TMEM16F KO mice after Lm infection at 3 dpi. J) TMEM16F expression, represented by ZsGreen fluorescence, in uninfected and Lm‐infected Tmem16f‐ZsGreen reporter mice (n = 3). MoMs, monocyte‐derived macrophages (CD45+F4/80+CD11bhiLy6Cint); Mos, inflammatory monocytes (CD45+F4/80+CD11bintLy6Chi). K) Flow cytometry analysis of KCs subsets in the liver from Lm‐infected WT and TMEM16F KO mice at 1 dpi. Data were pooled from two independent experiments (n = 6). KC1 are gated on CD45+CD11b+F4/80+CD64+TIM‐4hiCD206lowESAM−. KC2 are gated on CD45+CD11b+F4/80+CD64+TIM‐4hiCD206+ESAM+. All the experiments were repeated at least twice. Data are presented as mean ± SEM. Representative flow cytometry results were shown on the left panel and statistical analysis were on the right panel (F to I, K). Each dot represents one mouse. Two‐tailed Mann–Whitney test (A to E), unpaired Student's t test (F, G, I–K) or two‐way ANOVA (H) were used for statistical analysis. ns, not significant. * p< 0.05, ** p< 0.01, and *** p<0.001.
