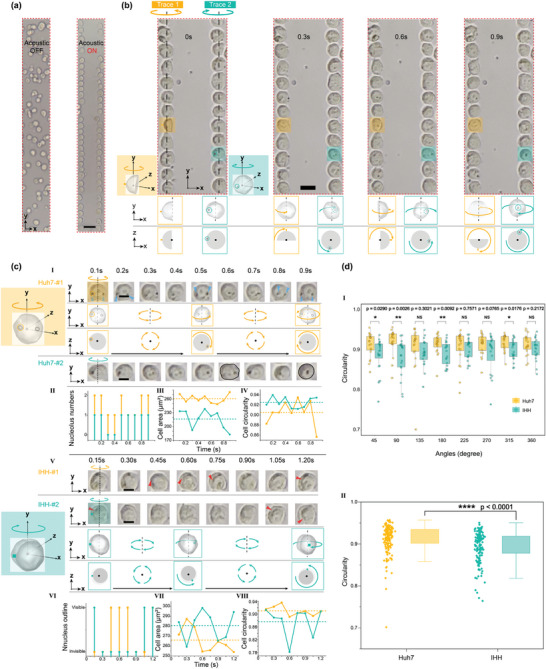
Figure 3.

High‐throughput cell rotation manipulation. a) Cells are trapped at the two PNs to form two traces of cells when the SAW is ON, which soon to rotate in situ. The red dashed box represents the cell rotation observation field. b) All the cells in the two traces are rotating driven by the surrounding acoustic streaming. c.I–IV) Examples of Huh7 (hepatocyte cancer line) cells during rotation. The morphology parameters including the nucleolus number, cell area, and cell circularity are changing during the rotation. c.V–VIII) Example of IHH (hepatocyte cancer line) cells during rotation. The morphology parameters including the nucleus outline visibility, cell area, and cell circularity are varying during the rotation. III, IV, VII, VIII) Quantification of cell area and cell circularity during rotation process of Huh7 and IHH cell lines, respectively. The dashed lines represent the average value of the cell area and cell circularity, which is calculated based on the sum of each time‐interval quantification for the total rotation process. d) I Cell circularity comparison between Huh7 cells and IHH cells under different observation angles during rotation. II) Rotation‐based multi‐angle integrated cell circularity comparison (n = 20). All p‐values were determined using one‐way ANOVA. NS: no significance. * p < 0.05, ** p < 0.01, **** p < 0.001. Scale bars in (a–c) are 50 µm, 20 µm, and 10 µm, respectively.
