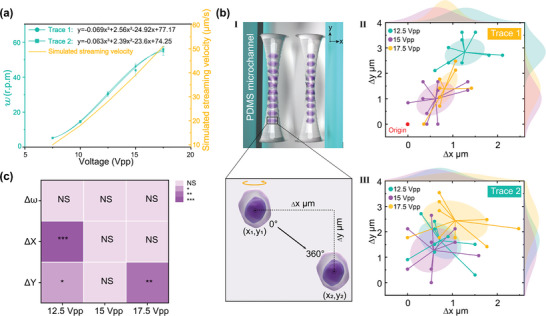
Figure 4.

Controllable cell rotation and the stability analysis. a) The measured rotational speed and the numerical calculated streaming velocity against the amplitude of the input signal (n = 15). b.I) Illustration of the cell displacement on the x‐ and y‐axes. b.II, III) Distribution of the cell shift on the x‐ and y‐axis for both cell traces (n = 30). c) Quantification of the rotation variation between cell trace 1 and trace 2 under three input voltages. All p‐values were determined using one‐way ANOVA. NS: no significance. * p < 0.05, ** p < 0.01, *** p < 0.001. Scale bar, 10 µm.
