Figure 1.
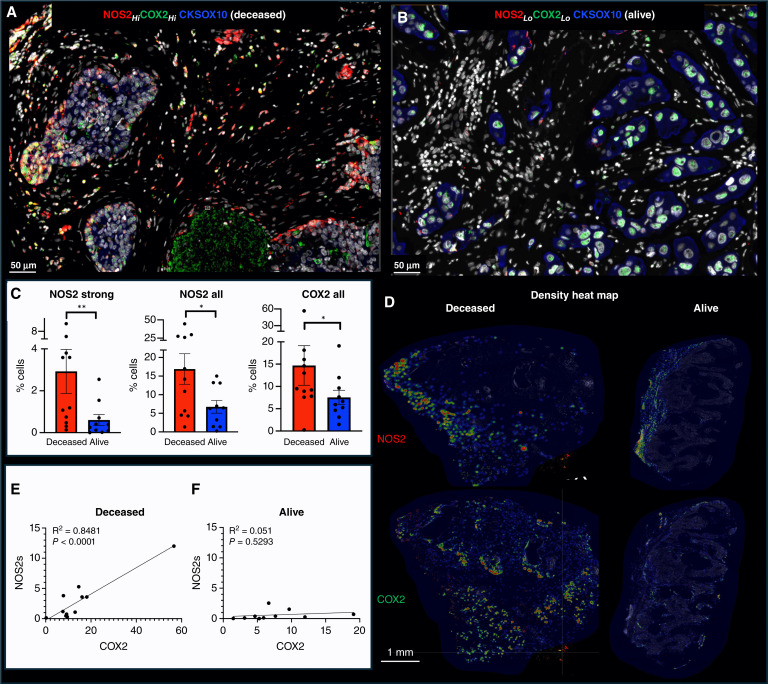
Spatial analysis of tumor NOS2/COX2 expression with respect to survival. Spatial landscape of NOS2 (red) and COX2 (green) with DAPI (white), the tumor marker CKSOX10 (blue) for (A) deceased and (B) alive patients at 5-year survival. C, Quantification of NOS2/COX2 tumor expression at the single cell level, with each dot representing a tumor sample (also shown in Supplementary Fig. S2). D, Heat density maps of tumor NOS2/COX2 expression in deceased and alive patient tumors. E, Significant Pearson’s correlation between tumor NOS2 and COX2 expression R2 = 0.8481 and P < 0.0001 in tumors from deceased patients but not alive patient samples (F). Mann–Whitney *, P < 0.05; **, P ≤ 0.01.

