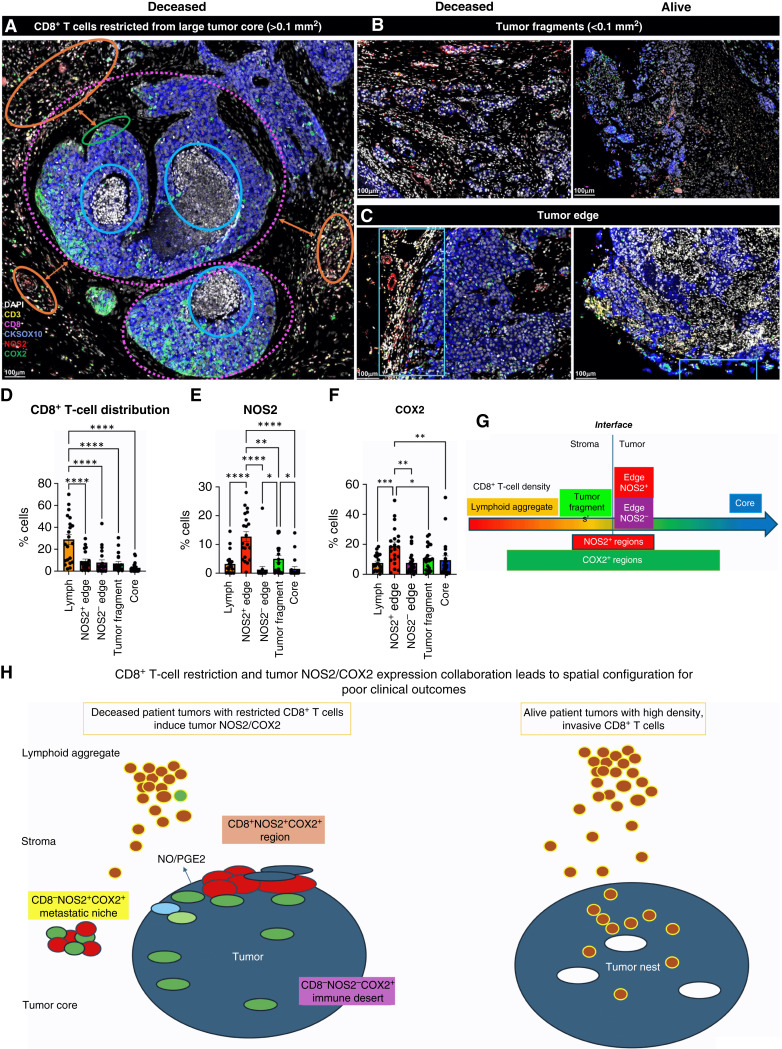
Figure 4.
Defined CD8 NOS2 and COX2 spatial landscape. Five basic regions showing (A) margin or stroma-restricted lymphoid aggregates (orange circles) in which a gap of 50 μm (double orange arrow) between CD3+ T-cell aggregates and the CKSOX10+ tumor edge (green circle) was observed. Blue and dashed magenta circles identify immune desert regions lacking CD8+ T cells. B, Tumor fragmentation or satellite region. C, Tumor edge with proximal stroma regions. D, Significant differences in % cell composition is shown for CD8+ T cells as well as (E) NOS2+ and (F) COX2+ tumor cells. G, Graphic summary of tumor NOS2/COX2 landscape and CD8+ T-cell regional distributions with respect to the tumor–stroma interface. H, Spatial architecture of predictive phenotypes in tumors from deceased vs. alive patients. *, P ≤ 0.05; **, P ≤ 0.01; ***, P ≤ 0.001; ****, P ≤ 0.0001.

