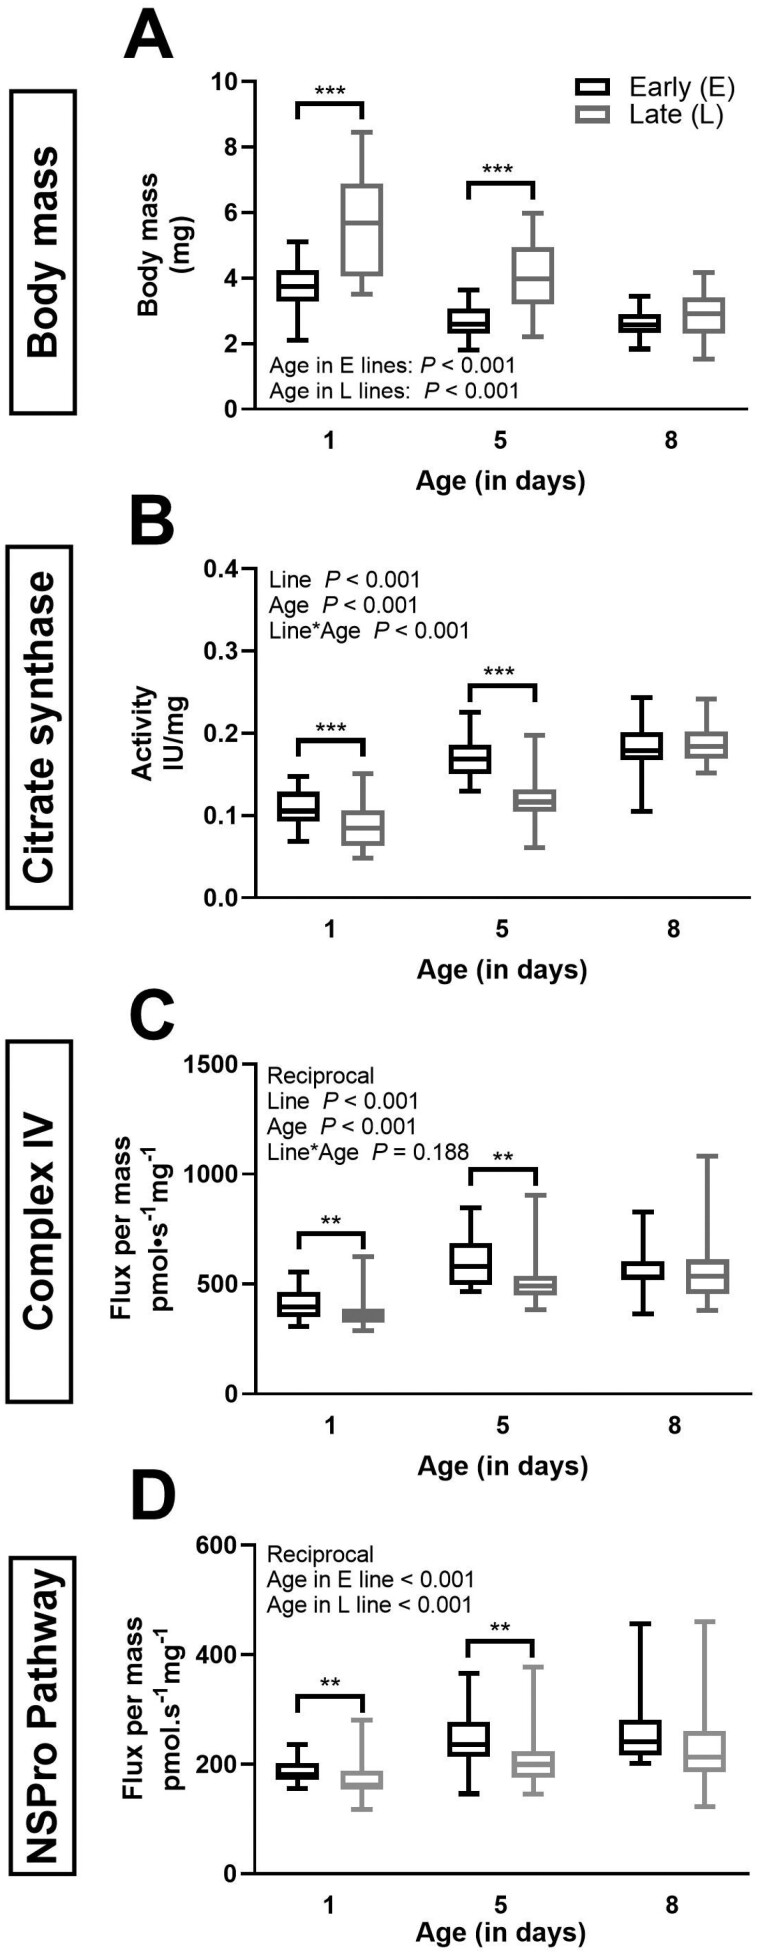
Figure 1.
Body mass and biomarkers of mitochondrial content in E and L lines beetles of various ages. Body mass in mg (panel A), citrate synthase (CS) in specific activity per milligram of seed beetle tissue (panel B), as well as complex IV (CIV; panel C) and NADH + Succinate + Proline (NSPro) combined pathway flux expressed as flux per mass of seed beetle tissue (panel D). Box plots indicate the minimum, 25th percentile, median, 75th percentile, and maximum. The data are a pool of females and males (in the E line, n = 32 at day 1, n = 28 at day 5, and n = 22 at day 8, in the L line, n = 28 at days 1 and 5, and n = 30 at day 8). Two-way ANOVA p values for the effects of line and age as well as the interaction between line and age are indicated in each panel. Body mass data (panel A) did not meet the assumptions and the following tests were performed: 1-way ANOVA (line effect at day 5) and Kruskal–Wallis ANOVA on ranks (age effect within L and E lines, and effect of selection line at days 1 and 8). CS (panel B) data did not undergo any transformations. Data underwent reciprocal transformation to meet the assumptions of the 2-way ANOVA for CIV (panel C) and the 1-way ANOVA for NSPro (panel D). Significant differences between the beetle lines for specific ages are denoted *p ≤ .05), **p ≤ .01, and ***p ≤ .001.

