
FIGURE 1.
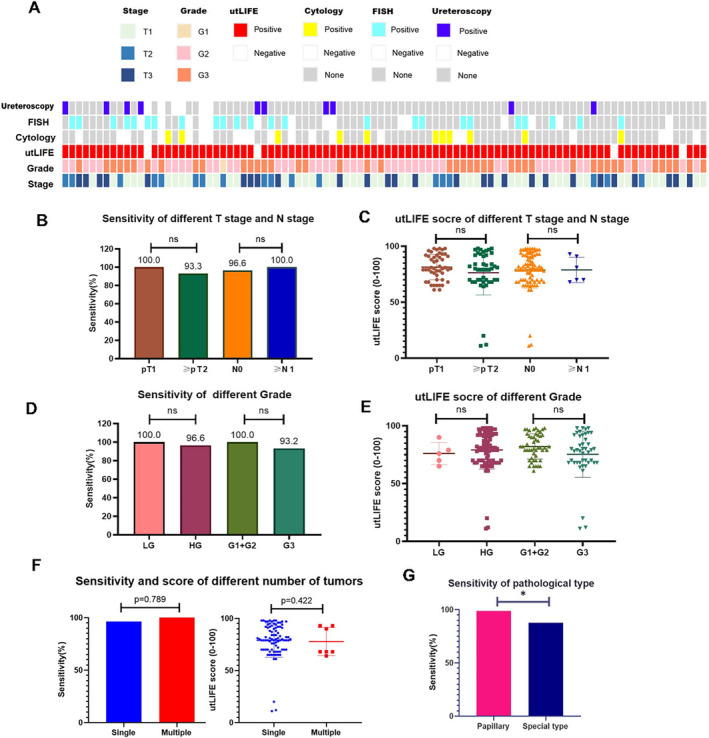
The performance of utLIFE in the diagnosis of UTUC. (A) Distribution of predicted diagnostic status using utLIFE of UTUC patients. (B–E) The sensitivity of utLIFE model to detect UTUC in different pathological T stages and grades. (F) The sensitivity of utLIFE model in different numbers of UTUC. (G) The sensitivity of utLIFE model in different pathological types.