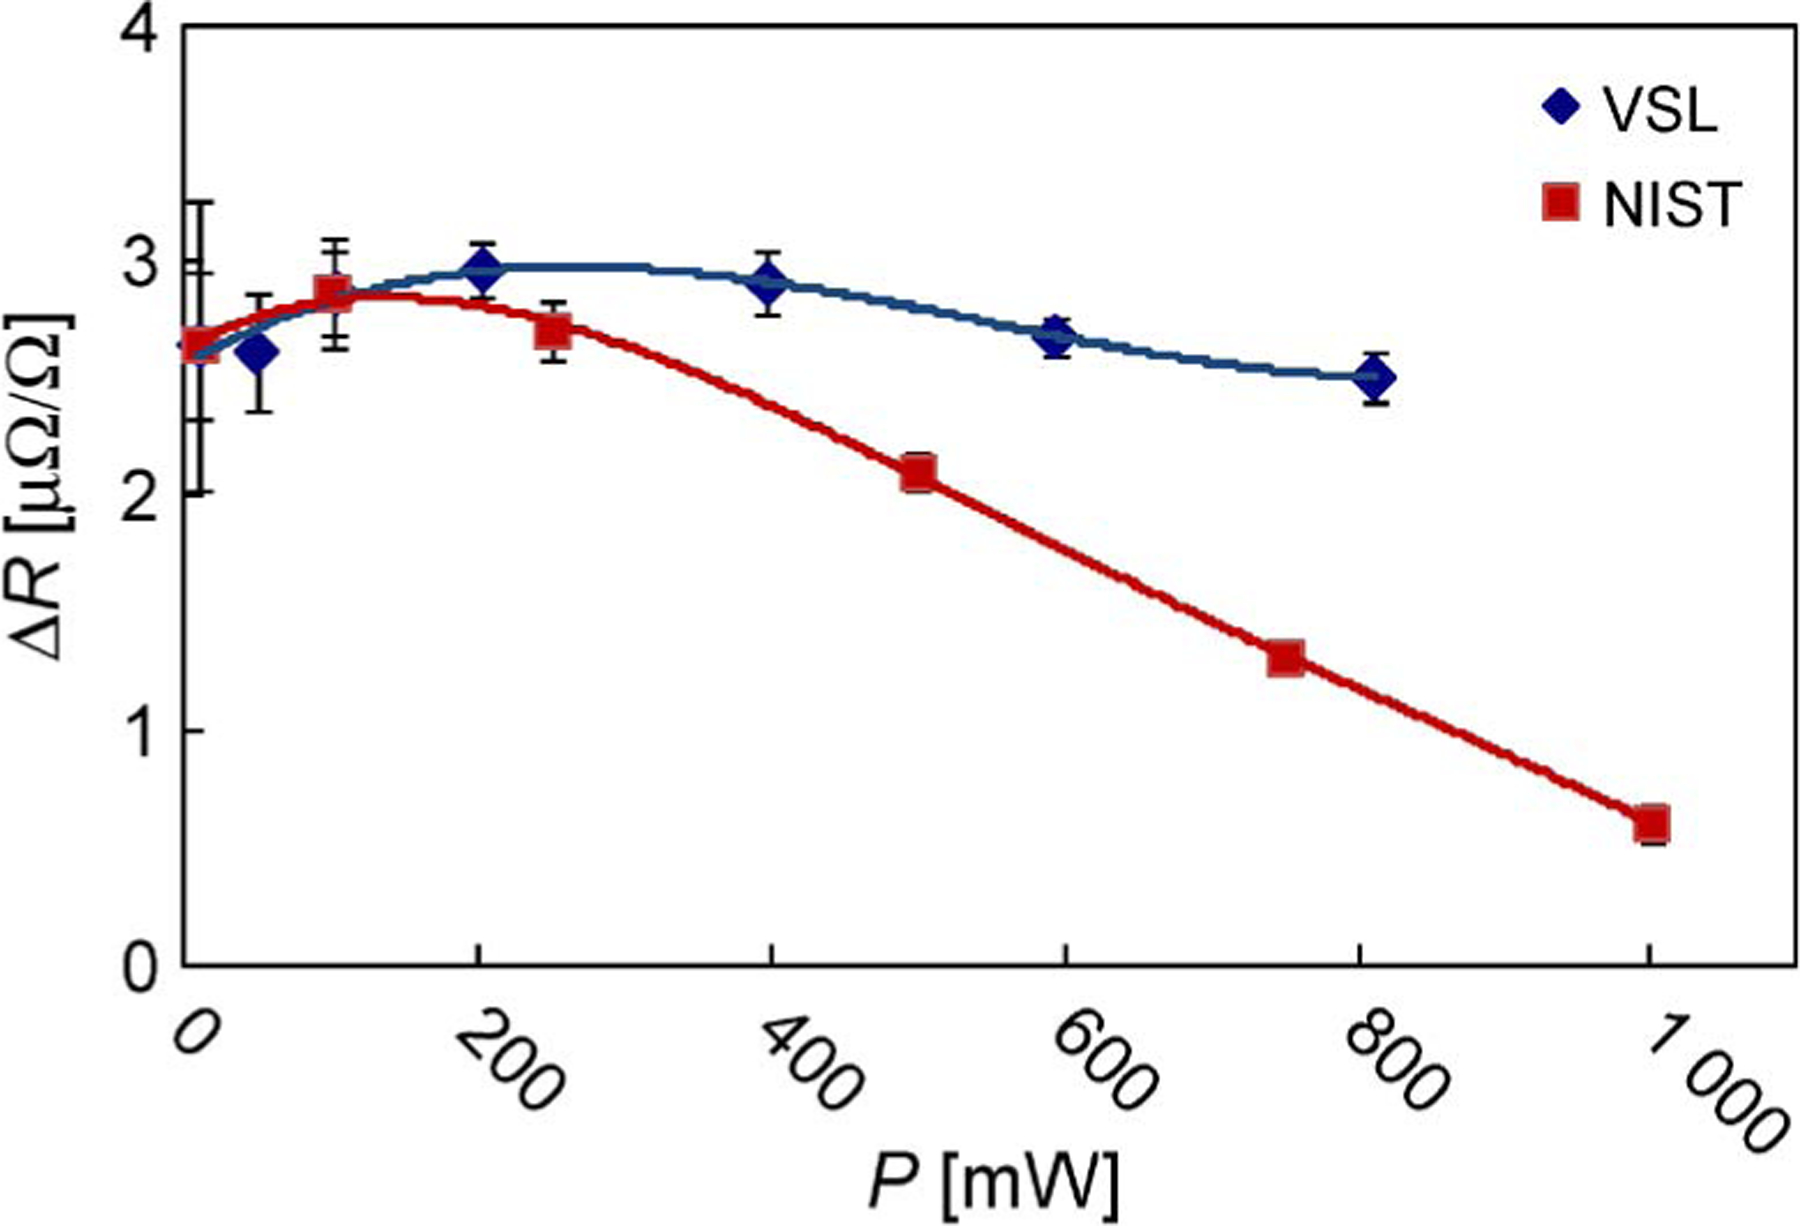
Fig. 3.

Effect of measurement power P on the resistance value ΔR, expressed as relative deviation from nominal value, of the L&N 100-μΩ standard resistor number 7. Uncertainty bars give the experimental standard deviation (type A; k = 1) only; lines are a guide to the eye through the data.
