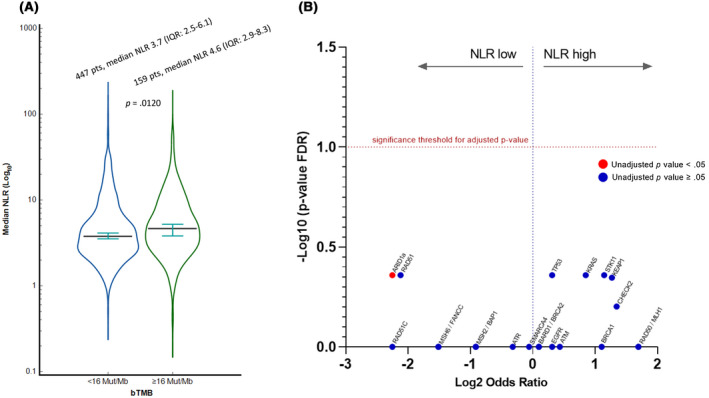
FIGURE 4.

(A) Violin plot reporting the median baseline NLR (log10) according to the categorized bTMB (≥16 vs. <16 mut/Mb). (B) Volcano plot summarizing the FDR‐adjusted targeted cfDNA analysis. The only gene mutation significantly associated with the NLR (NLR low) was ARID1A(unadjusted p value < .05). After adjustments for multiple comparisons, none of the 15 selected genes of interest were associated with the NLR. bTMB indicates blood tumor mutation burden; cfDNA, circulating free DNA; FDR, false discovery rate; IQR, interquartile range; NLR, neutrophil to lymphocyte ratio; pts, patients
