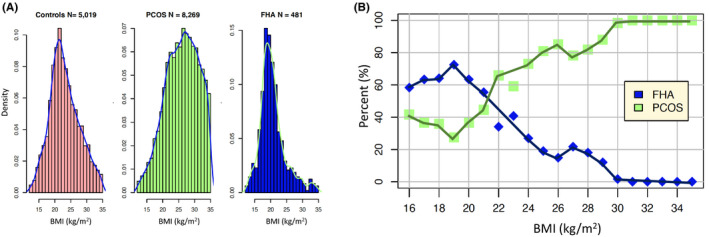
FIGURE 1.

(A) The summary statistics of the studies given in Table S1 were used to simulate truncated normal data in the 12–35 kg/m2 range for BMI using a Ferguson‐Klass type algorithm for posterior normalized random measures. Instance sizes, histograms and densities of the combined data are shown for controls (left panel), PCOS (centre panel) and FHA (right panel). The y‐axes are density centiles, so 0.15 represents 15% of the total instances. (B) The 481 simulated FHA values are combined with 1000 sampled values from the simulated PCOS data so as to match the proportions expected. For each BMI in the range 16–35 kg/m2 the percentage of FHA and PCOS instances are shown. The blue and green percentages sum to 100 for each BMI. The distributions presented are simulations of summative statistics from Table S1 that reflect the same underlying populations but are not exact representations of the distribution of the original data
