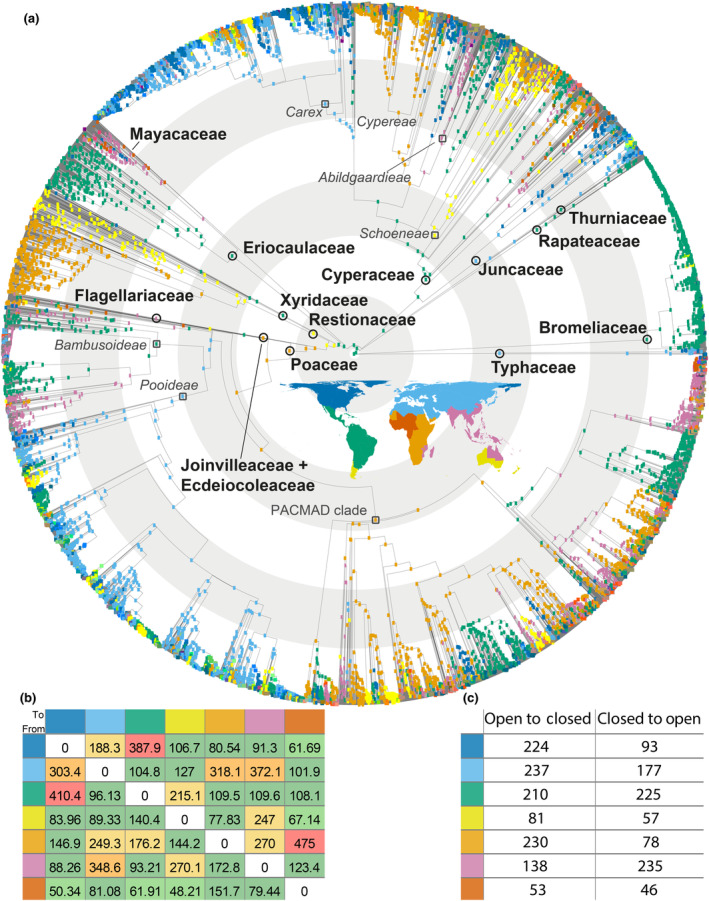
Fig. 3.

Ancestral area reconstruction within Poales based on seven regions, obtained using the dispersal–extinction–cladogenesis (DEC) model in BioGeoBEARS (a). A global map showing colours corresponding to the seven defined areas for the BioGeoBEARS analysis is in the centre of the phylogenetic reconstruction. The crown nodes of the families within Poales are shown with black circles, whereas dark grey squares are used to depict lineages important for the study's interpretations. Concentric light grey/white rings underlying the phylogeny indicate time slots of 20 Myr intervals. Note that Joinvilleaceae and Ecdeiocoleaceae are depicted together for visual purposes. Number of dispersal events between the seven regions inferred using Biogeographical Stochastic Mapping on the DEC model (b), and (c) number of transitions between open and closed habitats inferred to have occurred within each of the seven areas, calculated through comparison of best fitting corHMM models and historical biogeographical estimates. The colours of row and column labels in (b) and row in (c) correspond to those on inset map in (a).
