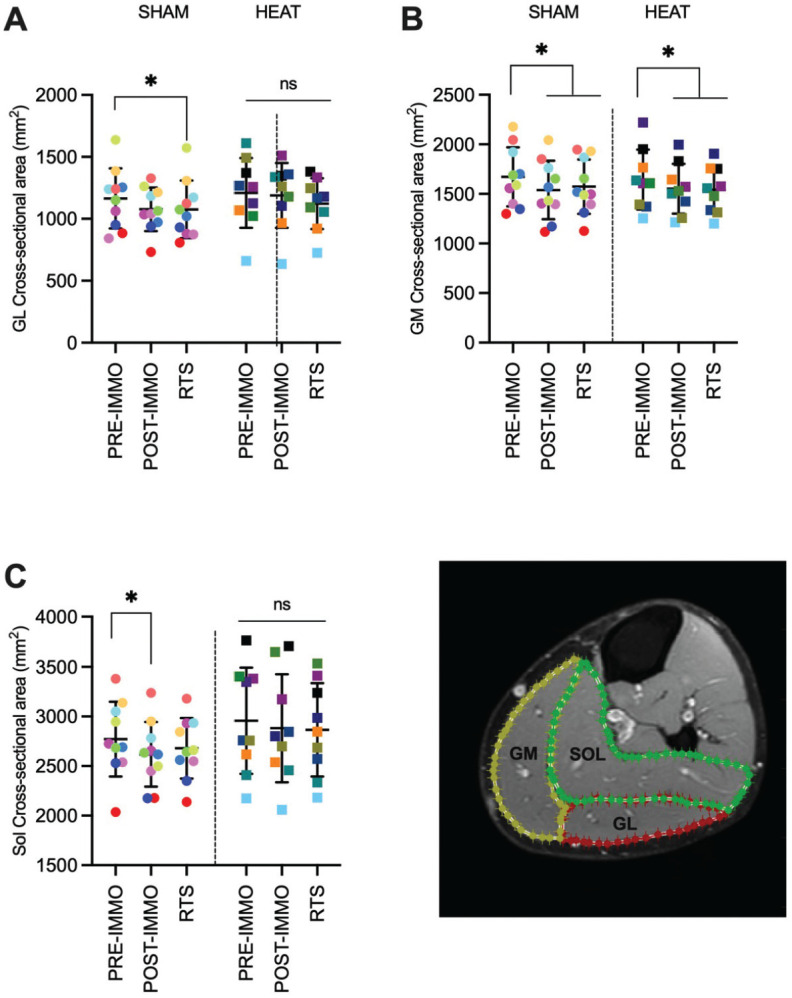
Figure 4.

Individual and mean (±SD) cross-sectional areas were obtained from MRI scans for the (A) GL, (B) GM, and (C) SOL muscles. Data are shown for the SHAM and HEAT groups preimmobilization (PRE-IMMO), postimmobilization (PRE-IMMO), and after rehabilitation (RTS). (D) Representative image. *P < .05. GL, gastrocnemius lateralis; GM, gastrocnemius medialis; MRI, magnetic resonance imaging; ns, nonsignificant; RTS, return to sport; SOL, soleus.
