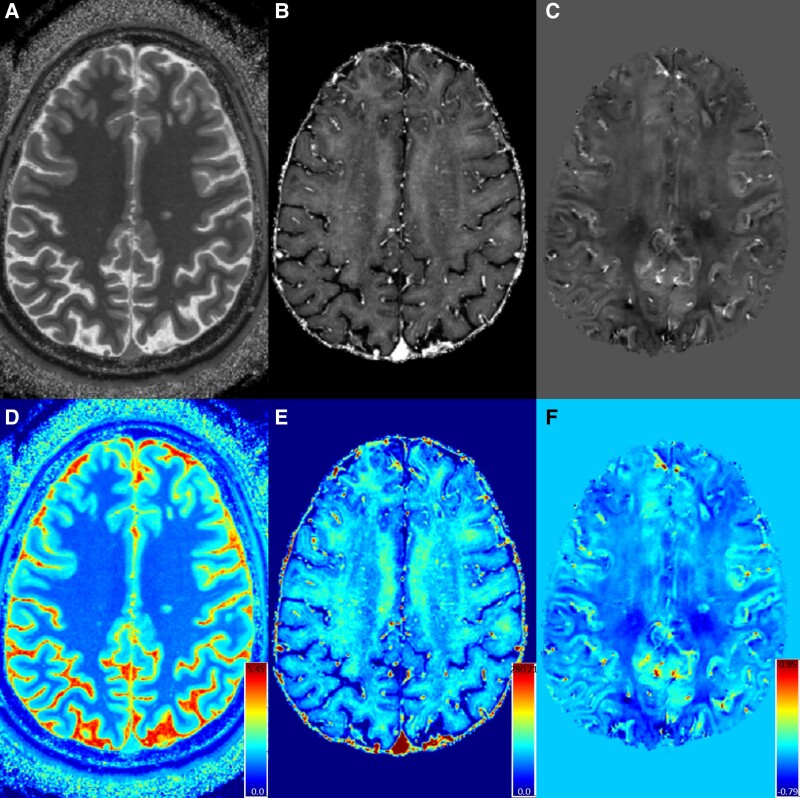
Figure 7.
Quantitative maps from 7T MRI. Shown are a T1 map (A, derived from MP2RAGE), R2* map (B, derived from multi-echo GRE) and QSM (C, derived from multi-echo GRE). Each map is shown in colour scale below (D, E, F) with units of seconds for T1 maps and milliseconds for R2* and relative susceptibility (normalized to CSF) for QSM. Quantitation from these maps can be utilized for estimation of tissue myelin content, cell loss, etc.

