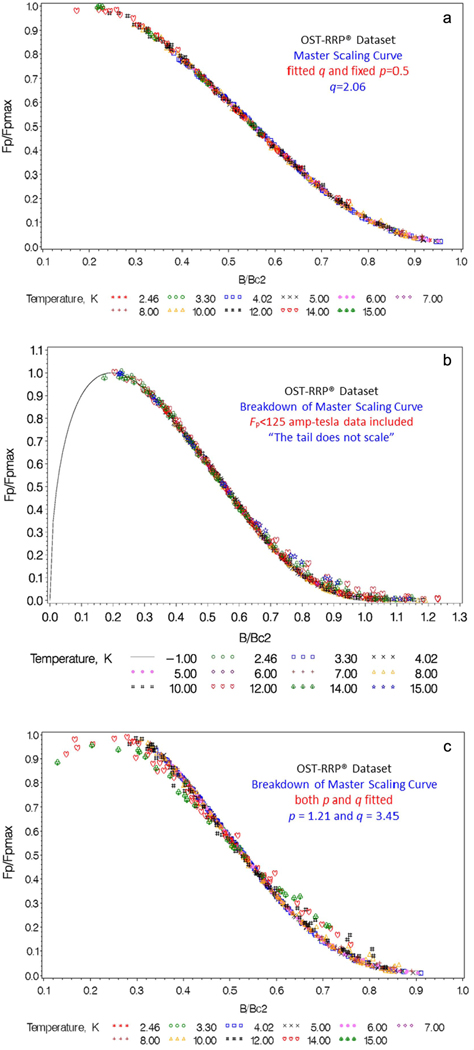
Figure 10.
Master scaling curves for the OST-RRP® dataset (not corrected for magnetic self field). (a) An example of a precise master scaling curve that results from registering curves (for this example, is fixed at 0.5, is fitted, and data are trimmed below AT). (b) The tail of the master curve does not scale well when low- data (<125 AT) are not trimmed, although the presence of such a low pinning-force tail does not have much effect on overall extrapolation errors (see text). (c) Loss of scaling when is fitted when there is insufficient data below the pinning-force peak (note the high fitted value of in this case).

