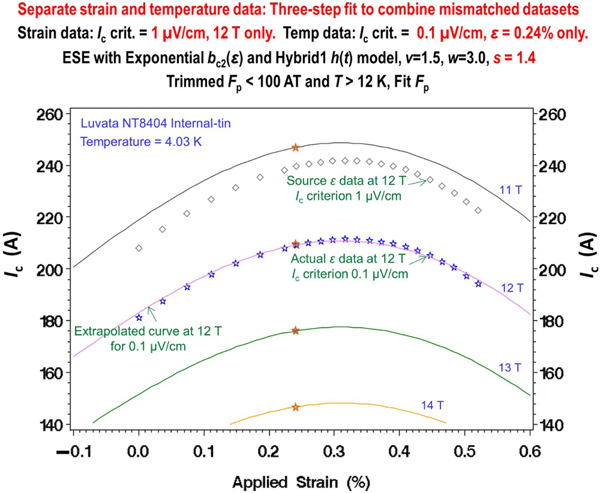
Figure 11.
Illustration of the use of the ESE equation with the three-step iterative fitting procedure to combine two separate, mismatched datasets: measured at an criterion of in a variable-temperature apparatus, and measured at 1 in a separate strain apparatus. The 12 T pink curve obtained by an iterative process from source data (light grey diamond symbols) agrees with the actual data (blue star symbols) to within about ±1%. The variable-temperature data are shown at 4.03 K by the orange star symbols at 0.24% strain, near the peak of each strain curve.

