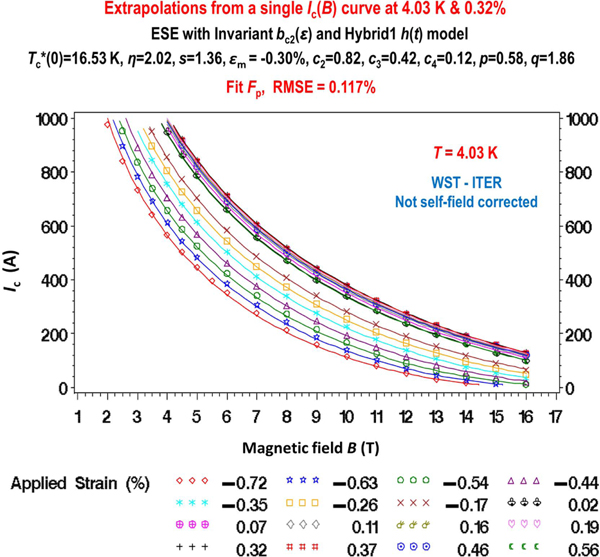
Figure 14.
Strain extrapolations from a single curve at 4.03 K and an applied strain of 0.32% (cross symbols, nested in the upper grouping of curves). Data are for the WST-ITER conductor, uncorrected for self field: symbols show measured data, and curves the calculated results. The RMS extrapolation error is 0.117%, only 0.01% higher than fitting the entire dataset (second row of table A2). Extrapolated curves are shown at 4.03 K for a wide range of applied strains (–0.72% to +0.56%) (intrinsic strains of –1.02% to +0.26%). curves are extrapolated with equation-set (11) and the Invariant strain function [equations (17)–(18)]. Values of and are fixed to those used for the core parameters (second row of table A2).

