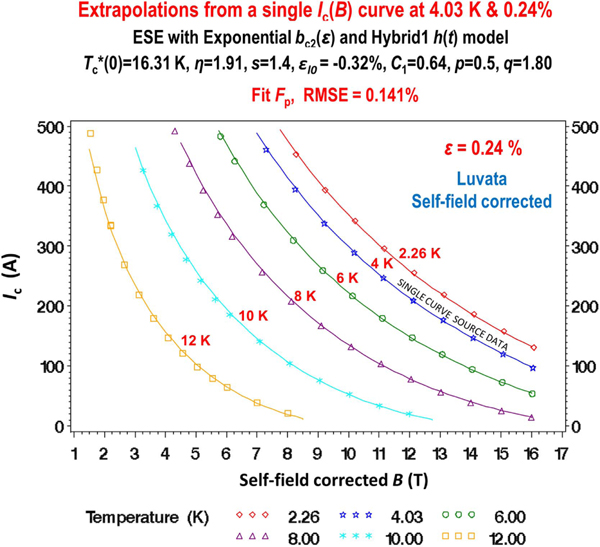
Figure 15.
Temperature extrapolations from a single curve at 4.03 K (blue star symbols), showing high accuracy down to 2.26 K and up to 12 K. Data are for the Luvata conductor, corrected for magnetic self field: symbols show measured data, and curves the calculated results. Fitting is carried out with the ESE-Hybrid1 equation (11), applied with the Exponential strain model [equations (19)–(22)]. Values of and are fixed to those used for the core parameters (second last row of table A3).

