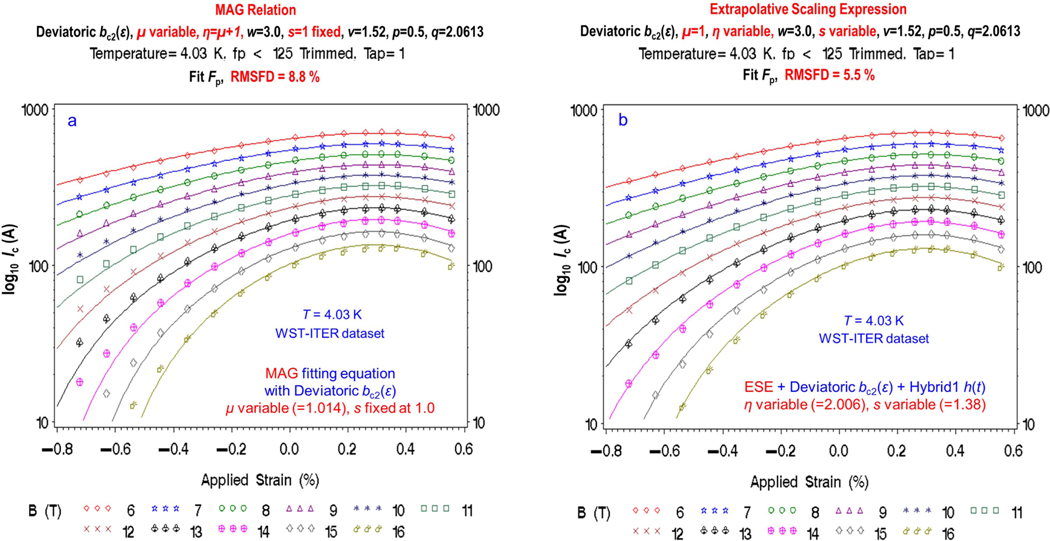
Figure 5.
Interpolation errors for the MAG equation for fitting all the given data at 4.03 K (figures 3 and 4 were at the extrapolated temperature of 12 K). Solid curves show the fitted interpolation curves, and symbols indicate the given 4.03 K data for the moderate- WST-ITER conductor. (a) The MAG equation shows relatively large interpolation errors (up to 50% of the measured data at high compressive strains and magnetic fields; note the semi-logarithmic scale). (b) The ESE equation, where is freed to be a fitted parameter, shows reductions in interpolation errors down to as little as 1/15th the size at high magnetic fields and compressive strains. The particular temperature parameterization used for in ESE for figure 5(b) made only a small difference, as shown by the comparably low RMSFD and RMS errors for fitting either or with the ESE relation parameterized with the same Deviatoric as the MAG relation (cases 5 and 7 in tables 1 and 2). The main difference in fitting errors between the MAG and ESE relations is a result of the fixed exponent in the MAG model. For the example shown in figure (b), the globally fitted value of in the ESE equation was , consistent with the values obtained for the ITER conductors () from analysis of raw scaling data (section 4.4 in Part 2).

