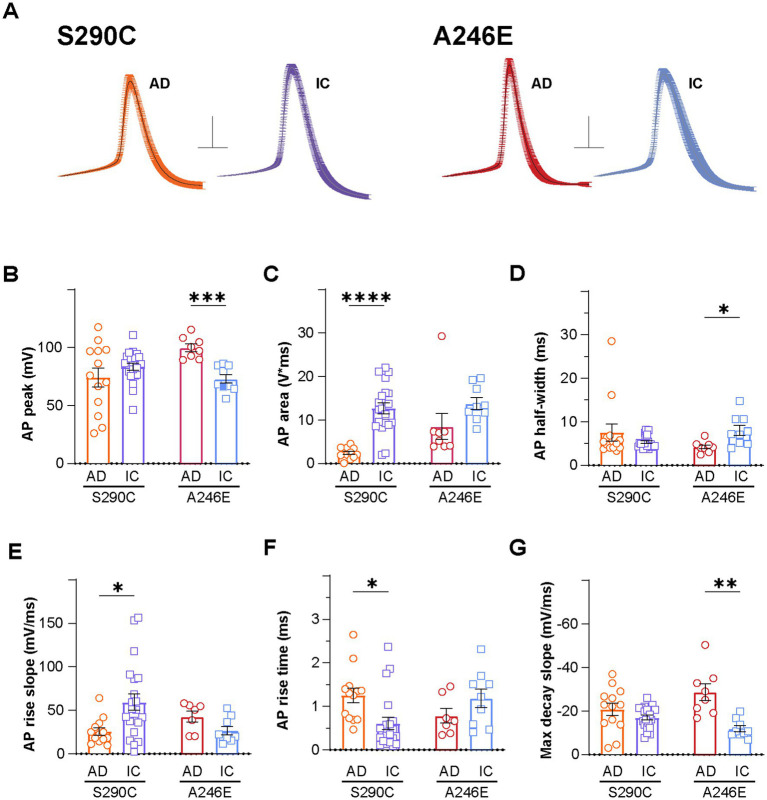
Figure 2.
AD induced neurons display altered action potential properties compared to isogenic controls. Action potential properties were also compared between AD patient lines with PSEN1 mutations (S290C and A246E) and isogenic controls, including (A) action potential waveforms, where the first action potential from each neuron fired at rheobase was aligned at the point of initiation and the resulting mean ± SEM waveforms are presented (Scale: 20 mV, 5 ms), (B) peak amplitude, (C) area, (D) half-width, (E) rise slope, (F) rise time and (G) max decay slope. Data is presented as the mean ± SEM. Each data point represents an individual cell (n = 7–41), from 3 independent differentiations. Data was analyzed using multiple t-tests with Holm-Sidak for multiple comparisons where *p < 0.05, **p < 0.01, ***p < 0.001, and ****p < 0.0001. AD, Alzheimer’s disease; IC, isogenic control.

