
FIGURE 2.
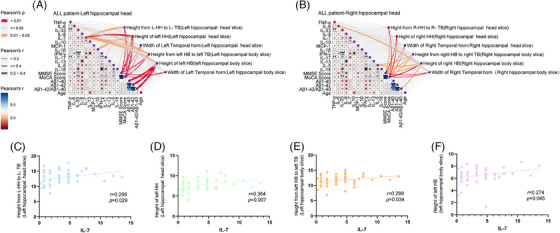
Correlation of IL‐7 with hippocampal atrophy. A, Correlation analysis illustrating the relationship between 13 inflammatory cytokines and the degree of hippocampal atrophy in the left HH slices. B, Correlation analysis shows the association between 13 inflammatory cytokines and hippocampal atrophy in the right HH slices. C, A significant correlation was observed between IL‐7 levels and the height measurement from the L‐HH to the L‐TB in the L‐HH slice. D, A significant correlation was observed between IL‐7 levels and the height measurement of the L‐HH in the L‐HH slice. E, Strong correlation between IL‐7 levels and the height measurement from the L‐HB to the L‐TB in the L‐HB slice. F, Noteworthy correlation between IL‐7 levels and the height measurement of the L‐HB in the L‐HB slice. HB, hippocampal body; HH, hippocampal head; IL, interleukin; L‐HB, left hippocampal body; L‐HH, left hippocampal head; L‐TB, left temporal bottom