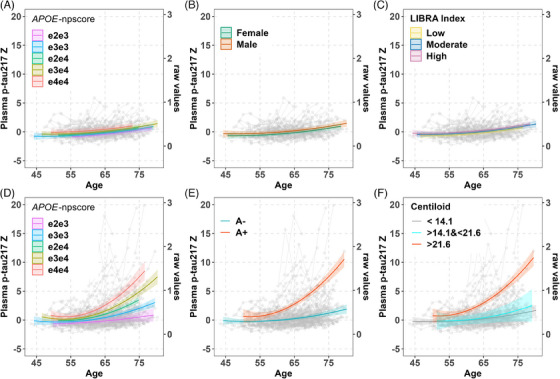
FIGURE 2.

Interaction plot from mixed‐effects model of plasma p‐tau217 in cognitively unimpaired amyloid‐negative (top row) and whole sample with known A status (bottom row). Estimates come from the significant main effects or interaction effects of best‐fitting regression models for plasma p‐tau217 in healthy control (A, B, and C), in whole sample with known A status before and after adding A status to the model (D and E), and in sample with PET amyloid (F). The predicted mean plasma p‐tau217 z‐scores for plasma are on the left y‐axis, the raw values are on the right y‐axis, and age in years is represented on the x‐axis. The observed data points are shown in gray. Bands represent 95% confidence intervals. Estimates are truncated to be within the age range of participants for a particular group. The predicted age‐related trajectories of plasma p‐tau217 are observed to be higher among APOE ε4 carriers, male participants, and those with a higher LIBRA index within the healthy control group (A, B, and C). Across the whole sample with known A status, changes in these trajectories were associated significantly with several factors in separate mixed‐effects models (D, E, and F). Specifically, APOE genotype influenced the rate of change, with the fastest decline seen in ε4/ε4 carriers, followed by ε3/ε4, ε2/ε4, ε3/ε3, and ε2/ε3, in that order. In addition, amyloid status (A+ vs A–) and amyloid Centiloid values also significantly impacted p‐tau217 trajectories. The effects varied significantly across different Centiloid ranges, with those >21.6 showing the most pronounced changes, followed by the 14.1 to 21.6 range, and the least changes observed in values,14.1.
