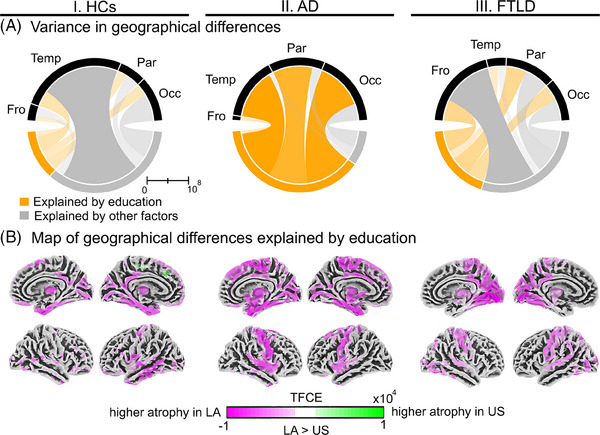
FIGURE 2.

Geographical differences (LA v. the US) explained by education in gray matter volume across conditions. Sections I, II, and III present information regarding HCs, AD, and FTLD, respectively. (A) Variance of the TFCE values within the cerebral lobes explained by education or other factors. All analyses were adjusted for age, sex, and total intracranial volume. (B) Map of the geographical differences explained by education. The image represented the subtraction of the TFCE values at the voxel level from two comparisons between (LA vs the US), controlled and uncontrolled through education. In these comparisons, the TFCE method accounted for familywise errors to correct multiple comparisons. AD, Alzheimer's disease; Fro, frontal; FTLD, frontotemporal lobar degeneration; HCs, healthy controls; LA, Latin America; Occ, occipital; Par, parietal; Temp, temporal; TFCE, threshold‐free cluster enhancement; US, United States.
