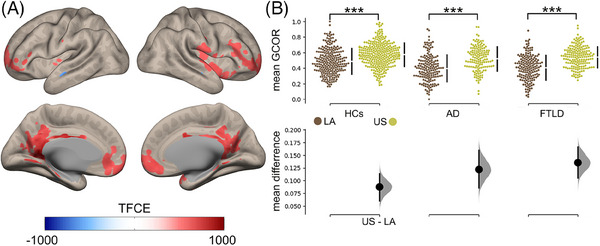
FIGURE 3.

Functional correlates of education differ between geographical regions. (A) Brain maps showing the association between educational attainment and functional connectivity, controlled by age and sex. Multiple comparisons were corrected with the TFCE method with a pFWE < 0.05. (B) Top panel: Scatter plots showing geographical comparisons across conditions for mean functional connectivity within areas associated with educational attainment. Comparisons were computed using the Kruskal–Wallis test. Bottom panel: The effect size of the geographical comparison across conditions. We utilized 5000 bootstrap resamples to calculate the mean differences. TFCE method to account for familywise error was used to correct multiple comparisons. AD, Alzheimer's disease; FTLD, frontotemporal lobar degeneration; GCOR, global correlation; HCs, healthy controls; LA, Latin America; TFCE, threshold‐free cluster.
