
FIGURE 5.
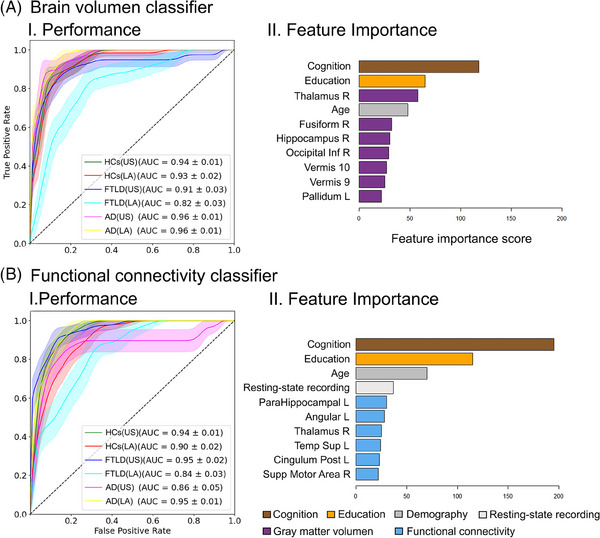
Multiclass classification across conditions and geographical regions. Classifiers used gray matter volume (A) and functional connectivity (B) data. Panel I displays performance through the ROC curve and the AUC score for the classification of each group against the others. Panel II displays the top 10 features, ranked by importance. Legend footnote: AD, Alzheimer's disease; AUC, area under curve; FTLD, frontotemporal dementia with lobar degeneration; HCs, healthy controls; Inf, inferior; LA, Latin America; L, left; Post, posterior; R, right; Supp, Supplementary; US, United States.