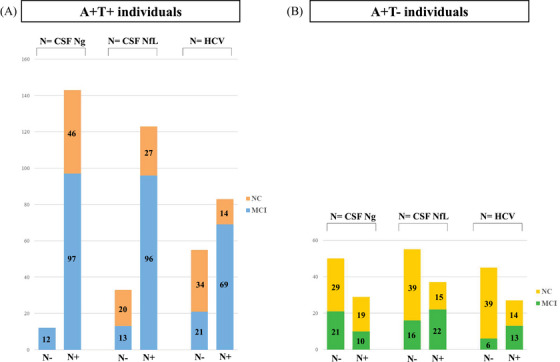
FIGURE 1.

A, Stacked bar graph showing the numbers of N+ and N− participants within the A+T+ group for the three neurodegeneration markers (i.e., CSF neurogranin, CSF neurofilament light, and hippocampal volume). The number of individuals with normal cognition (NC; orange) and mild cognitive impairment (MCI; blue) is also shown. B, Stacked bar graph showing the numbers of N+ and N− participants within the A+T− group for the three neurodegeneration markers (i.e., CSF neurogranin, CSF neurofilament light, and hippocampal volume). The number of individuals with NC (yellow) and MCI (green) is also shown. A−, absence of amyloid pathology determined by CSF Aβ42 level above cut point; A+, presence of amyloid pathology determined by CSF Aβ42 level below cut point; T−, normal CSF p‐tau level below cut point; T+, abnormal CSF p‐tau level above cut point; N−, absence of neurodegeneration or neuronal injury determined by CSF neurogranin, CSF neurofilament light, or hippocampal volume; N+, presence of neurodegeneration or neuronal injury determined by CSF neurogranin, CSF neurofilament light, or hippocampal volume. Aβ, amyloid beta; CSF, cerebrospinal fluid; HCV, hippocampal volume; MCI, mild cognitive impairment; NC, normal cognition; NfL, neurofilament light; Ng, neurogranin; p‐tau, phosphorylated tau.
