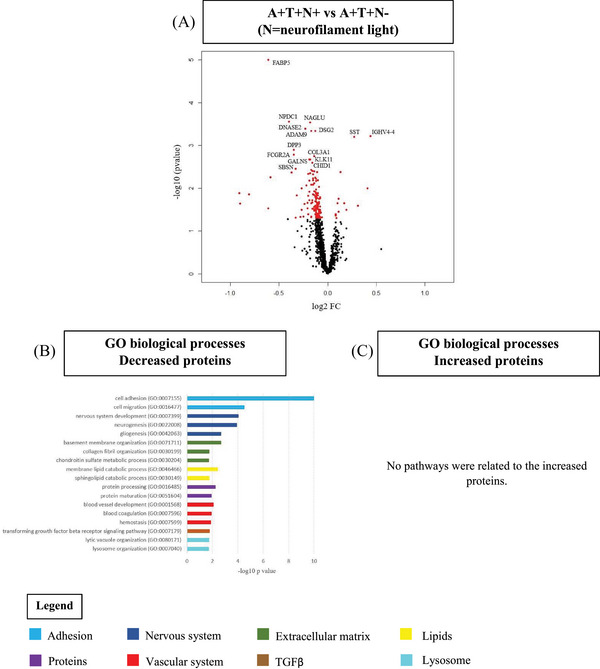
FIGURE 3.

CSF proteomics in A+T+ individuals without dementia by neurofilament light status. A, Volcano plot displaying the log2 fold‐change against the −log10 statistical p‐value for the comparison of A+T+N+ versus A+T+N− (N = neurofilament light). Significantly different proteins are red. The top 15 proteins are named. B, C, Selected biological processes Gene Ontology (GO) terms for decreased (B) and increased (C) proteins in the comparison A+T−N+ versus A+T−N−. CSF, cerebrospinal fluid; TGFβ, transforming growth factor beta.
