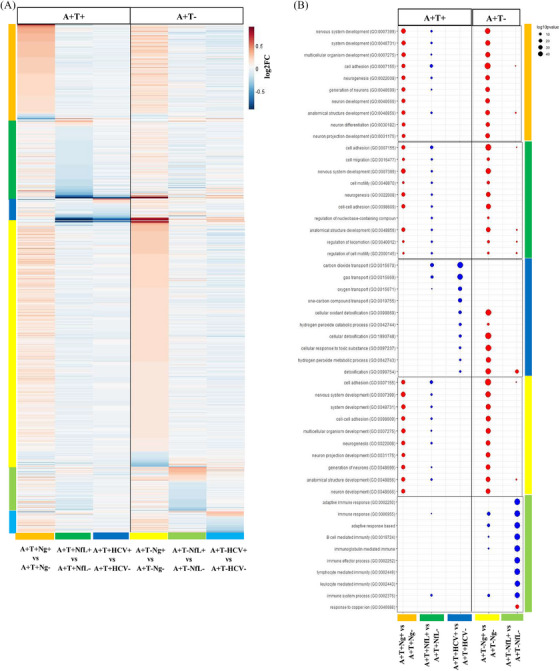
FIGURE 5.

Comparison of the proteomic profiles of the groups classified using distinct N markers. A, Heatmap representing the log2 fold‐change values of the proteins with significant level changes in each comparison using different neurodegeneration markers. B, Gene Ontology biological pathway enrichment analysis with a dot plot representing the top 10 biological pathways enriched for the different comparisons.
