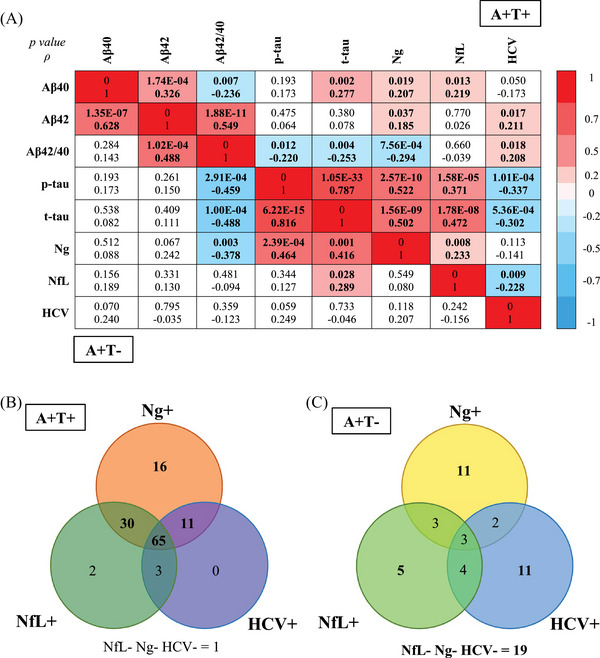
FIGURE 6.

Association between the different neurodegeneration biomarkers. A, Correlation matrix for AD biomarkers using the Spearman rank correlation test in A+T+ individuals with no dementia (upper part of the graph) and in A+T− individuals with no dementia (lower part of the graph). The figure presents the p‐value and correlation coefficient (ρ). The color scale depicts the strength of the Spearman correlation coefficient in the significant correlations. B, Venn diagram depicting the distribution of the three neurodegeneration biomarkers in a subset of 128 A+T+ individuals and with availability of the three N markers. C, Venn diagram depicting the distribution of the three neurodegeneration biomarkers in a subset of 58 A+T− individuals and with availability of the three N markers. Aβ, amyloid beta; AD, Alzheimer's disease; HCV, hippocampal volume; NC, normal cognition; NfL, neurofilament light; Ng, neurogranin; p‐tau, phosphorylated tau; t‐tau, total tau.
