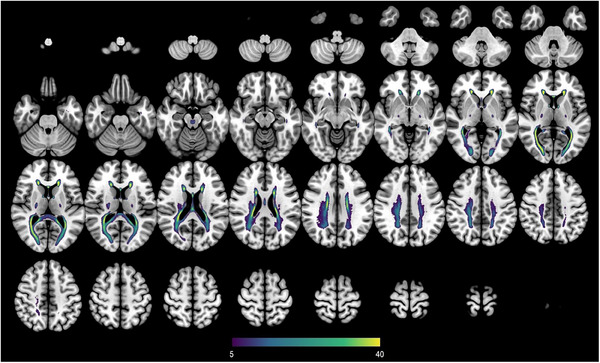
FIGURE 2.

Lesion prevalence map of white matter hyperintensities in Down syndrome. Lesion frequency map of white matter hyperintensities is shown in the Montreal Neurological Institute 152 T1 template. The color of each voxel indicates the percentage of subjects that had white matter hyperintensities in this voxel, ranging from at least 5% (purple) to 40% or more (yellow).
